Big takeaway: January was a slower start for the market overall, but the real softness is concentrated in higher-density housing (apartments and row homes) where supply has risen faster than demand.
Source: CREB® February 2, 2026 market release (January 2026 activity).
Big Picture: Slower Start, Especially for Apartments & Row Homes
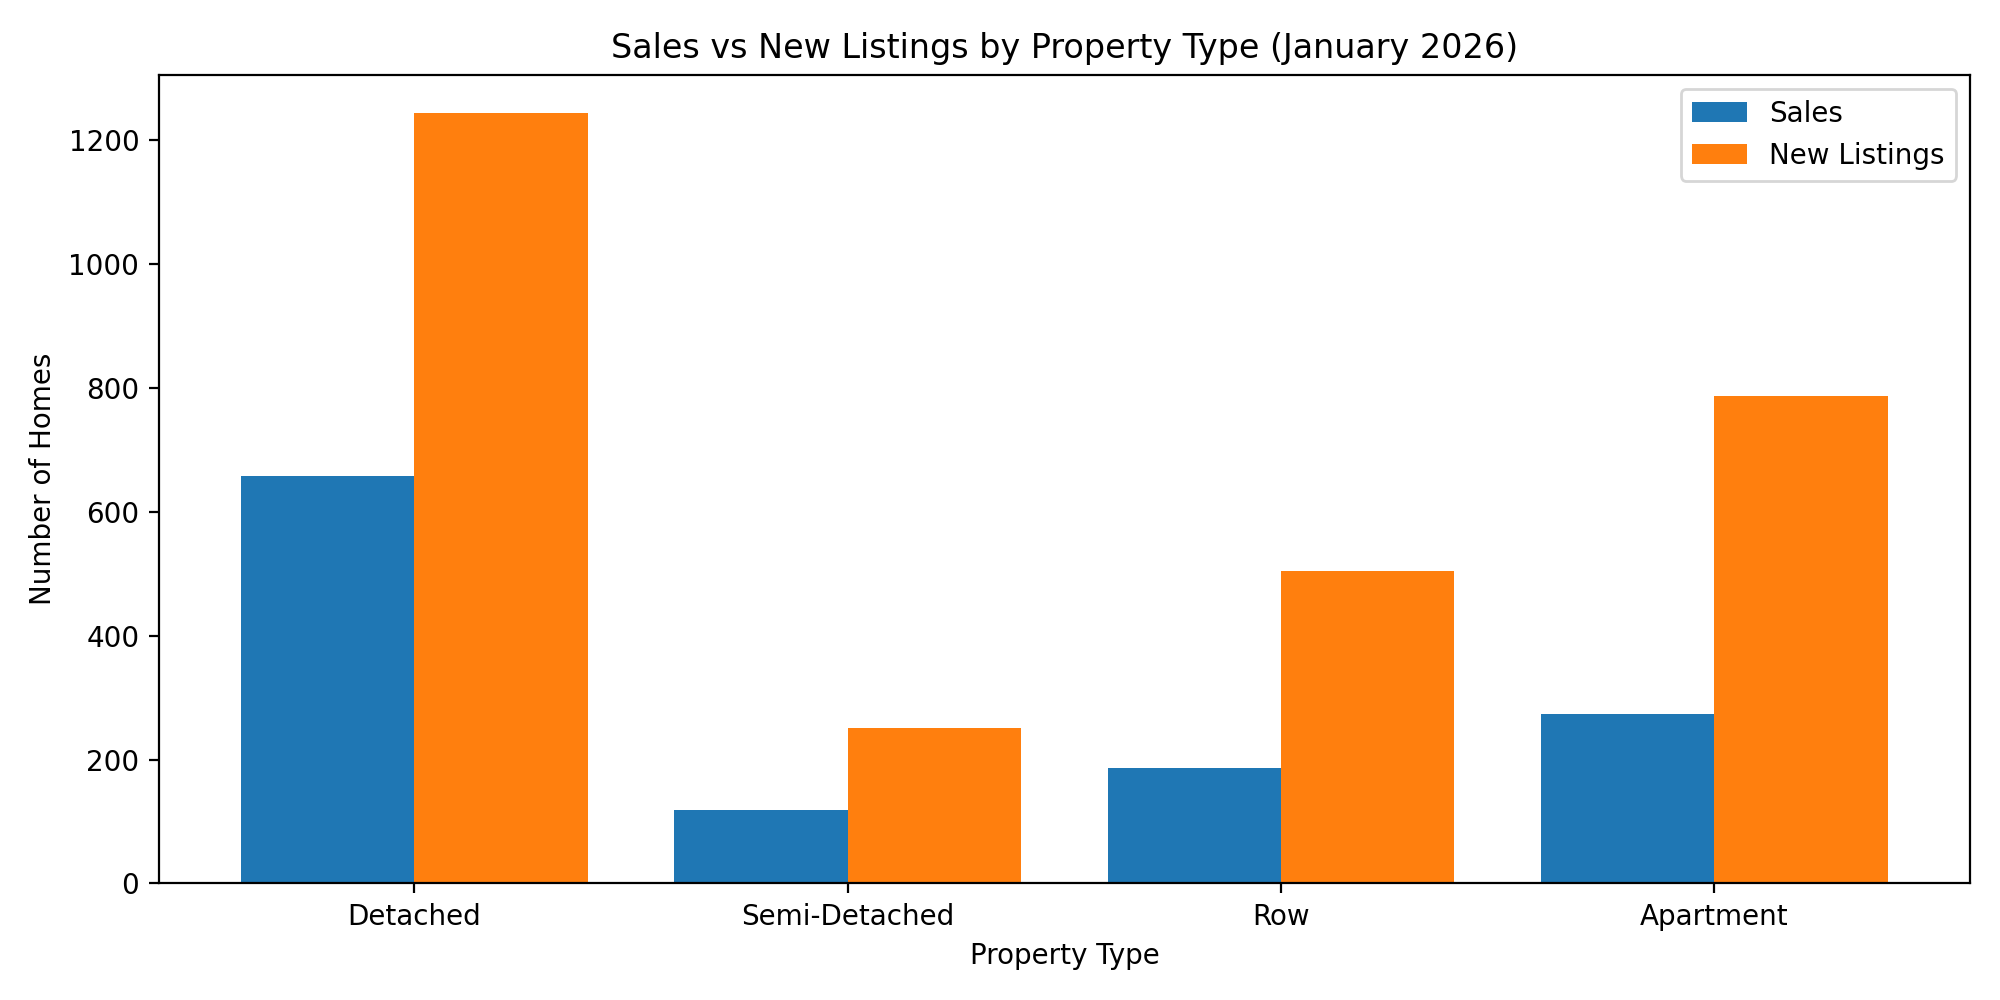
Calgary reported 1,234 sales in January, a 15% year-over-year decline, but still within the normal activity range for the month. The bigger story is where the slowdown happened: higher-density homes saw the steepest pullback as buyers returned more cautiously after the typical December slowdown.
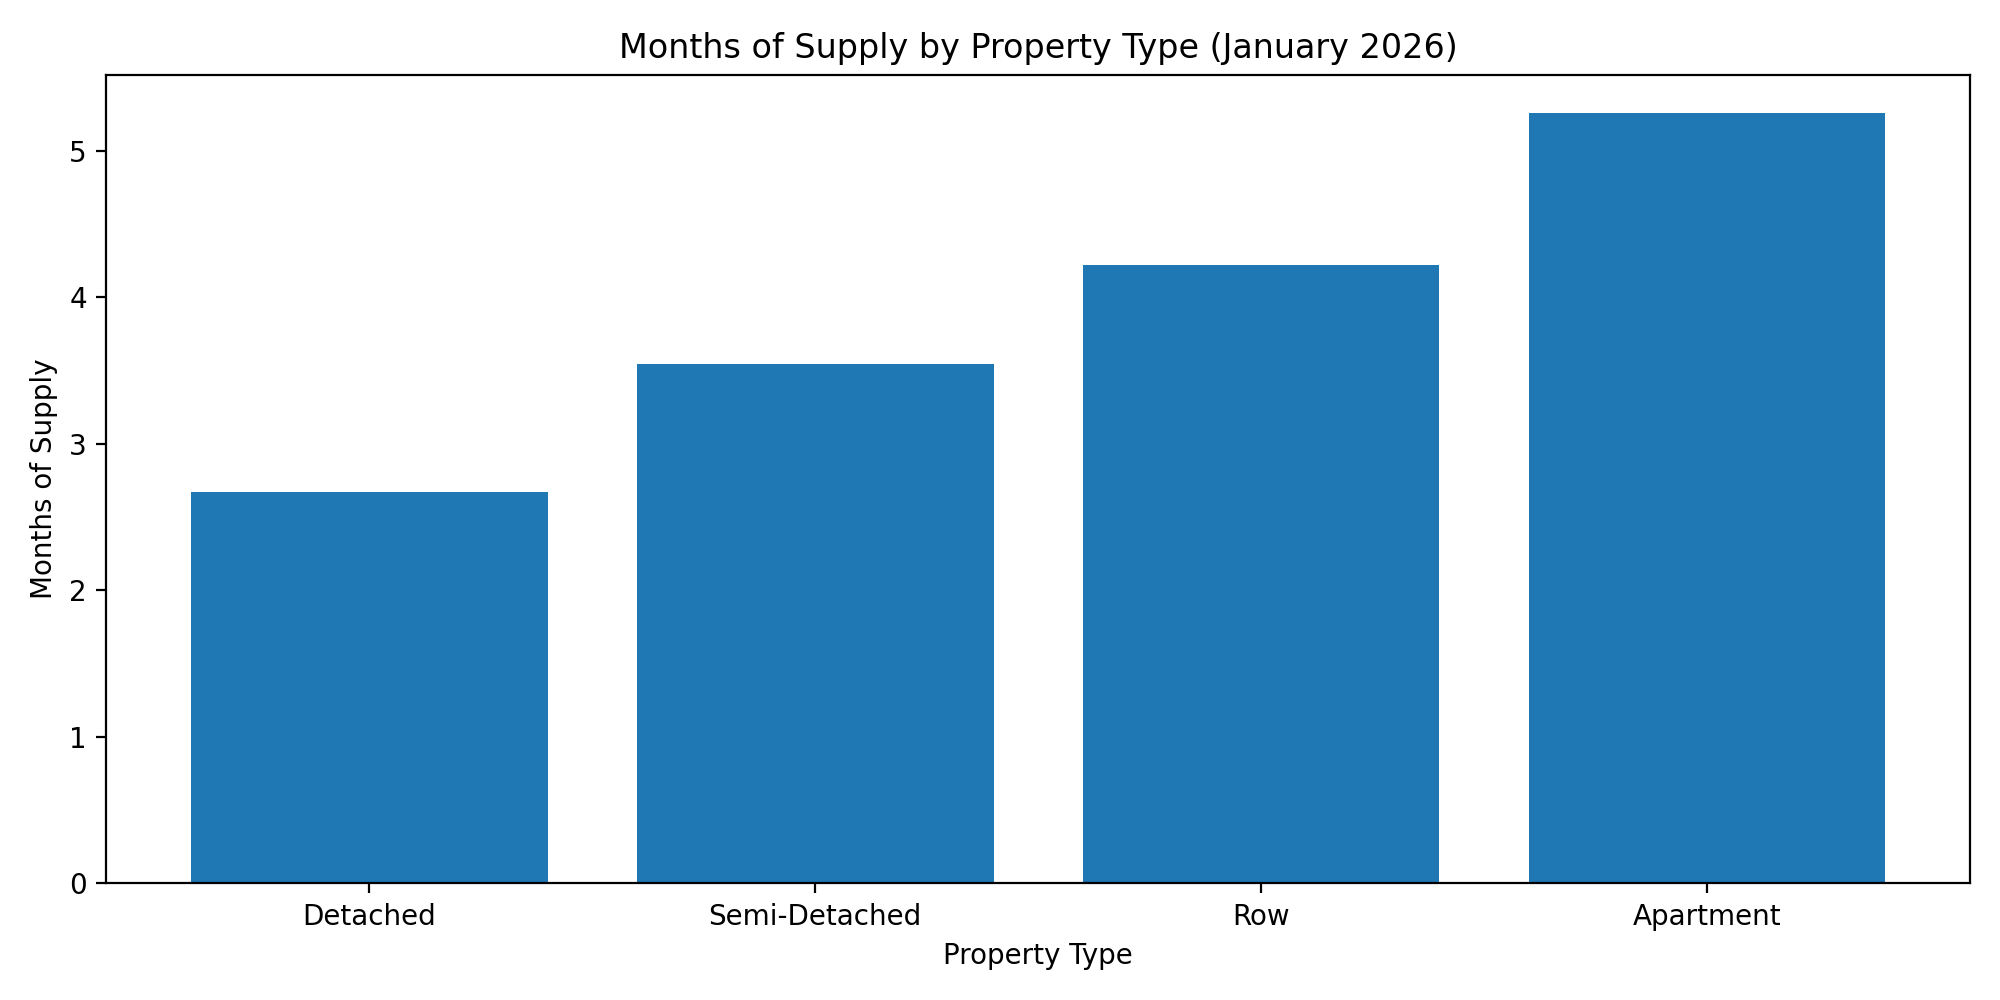
At the same time, sellers were quick to list, which pushed the sales-to-new-listings ratio down to 44% (with most of that shift tied to apartments and row-style homes). Inventory rose to 4,391 units—the highest January level since 2020—while months of supply ranged from under three months for detached homes to about five months for apartment-style homes.
Detached: Still the Most Stable Segment
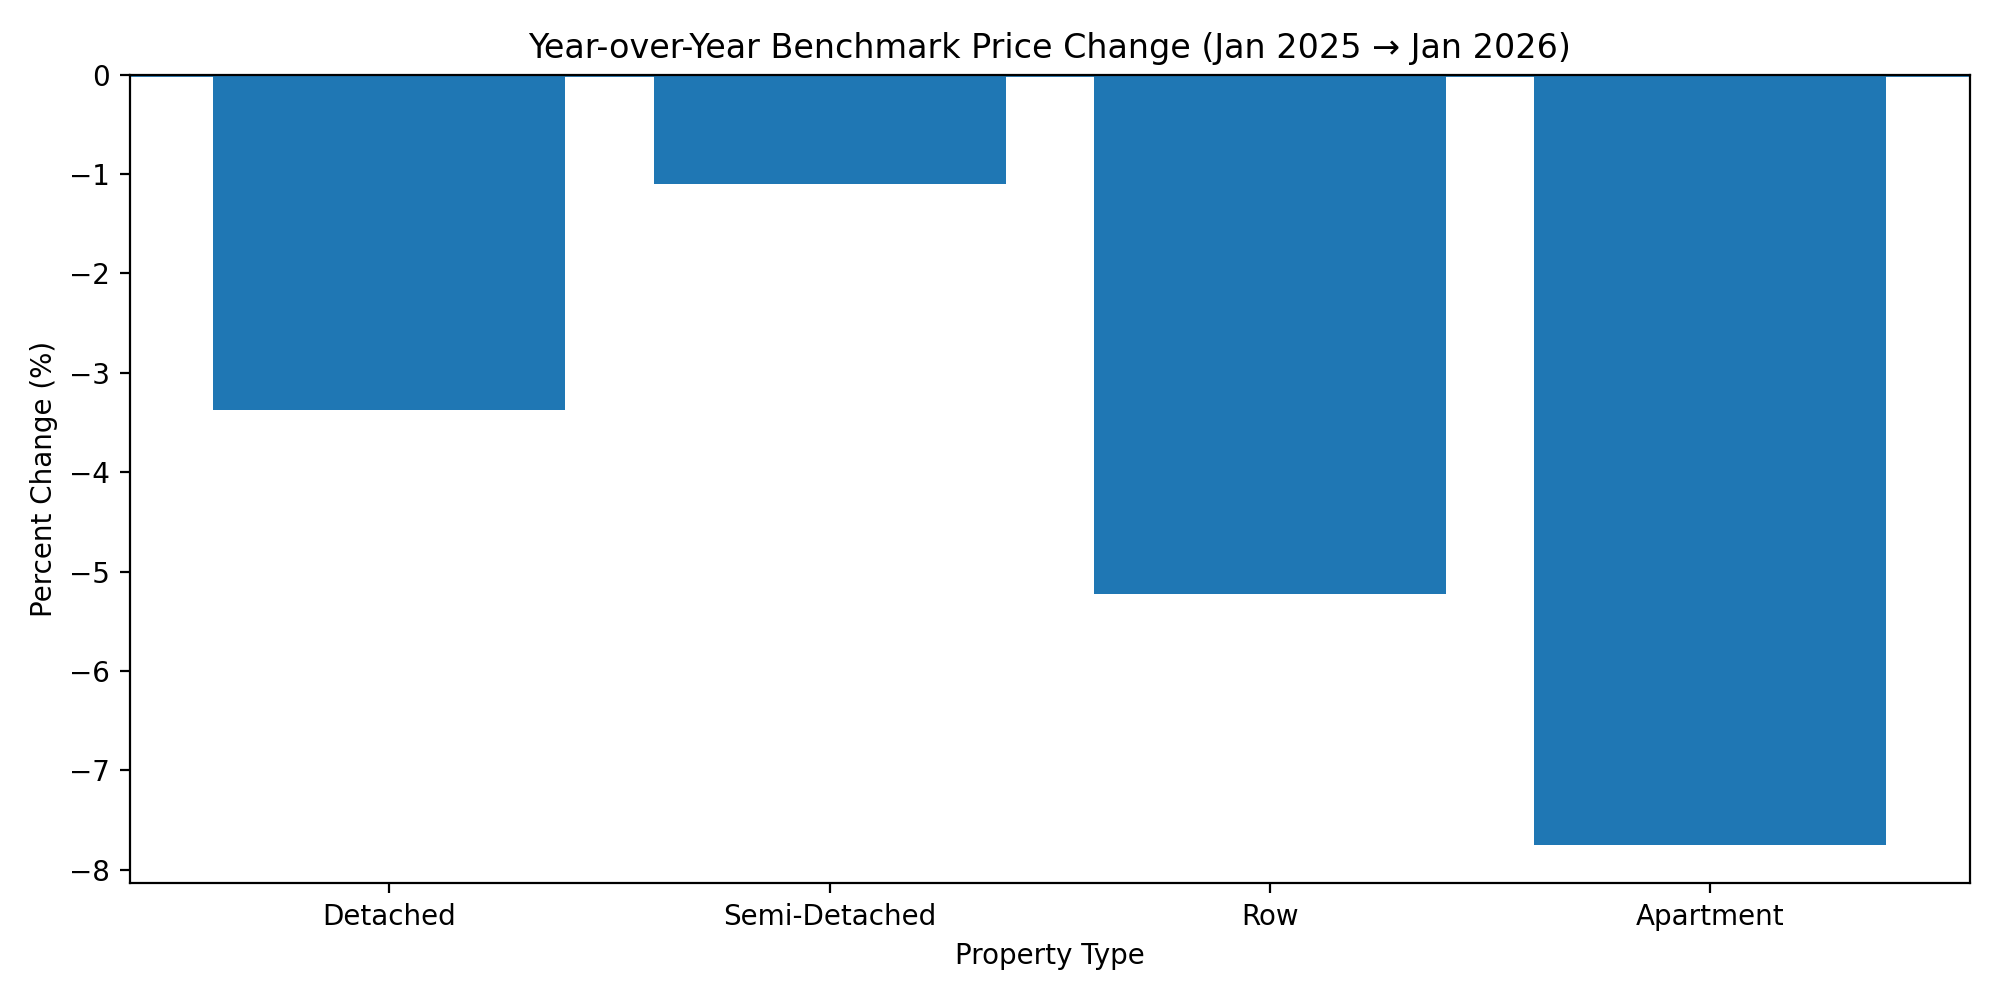
Detached conditions stayed relatively balanced in January with less than three months of supply and a sales-to-new-listings ratio near the low-50% range. Benchmark pricing eased slightly versus December and is a little over 3% lower than last January, reflecting the downtrend that developed through the second half of 2025. Price movements varied by district, with smaller declines in the West and larger year-over-year pullbacks in the North East.
Semi-Detached: Quietly Steady
Semi-detached homes improved over December in both sales and new listings, but listings rose faster, easing the sales-to-new-listings ratio into the high-40% range. With roughly three and a half months of supply, conditions stayed balanced. Benchmark pricing held close to December levels and was only about 1% lower than last January, suggesting supply growth is translating into stability rather than sharp declines.
Row Homes: Feeling Supply Pressure
Row homes saw the sharpest year-over-year sales pullback (down nearly 25%). New listings and inventory both rose, pushing months of supply into the four-month range. Benchmark pricing was similar to December, but still about 5% lower year-over-year. Some month-over-month stability showed up in the City Centre and West, while larger year-over-year adjustments were noted in the North East and East districts—areas facing heavier competition from the new-home market.
Apartment Condominiums: The Softest Market
Apartment-style units continue to carry the most supply. New listings increased sharply compared to December and remained well above sales, pushing the sales-to-new-listings ratio down into the mid-30% range. Inventory reached the highest January level on record, months of supply moved above five months, and benchmark pricing fell again—nearly 1% month-over-month and about 8% year-over-year. Year-over-year price declines were broad-based across the city, with larger drops reported in the North East and smaller (but still meaningful) declines in the City Centre.
Why Inventory Is Rising (And Why It Matters)
The simplest explanation is supply outpacing demand: in every property type, new listings exceeded sales in January. That doesn’t automatically mean prices collapse—January often sets the table for spring—but it does explain why buyers feel less urgency and why pricing has softened most in segments with the highest supply.
What This Means (Buyers vs. Sellers)
- Detached sellers: Conditions are still relatively balanced. Pricing and presentation matter, but demand is there.
- Row and apartment sellers: Expect more competition. Buyers have more choice, so the best results usually come from sharp pricing and strong marketing.
- Buyers: Selection is improving across the board, and negotiation leverage is strongest in apartments and row homes right now.
Wondering What This Means for Your Home or Plans?
Market shifts don’t affect every neighbourhood or property type the same way. If you're buying, selling, or just keeping an eye on your home’s value, it helps to look at the numbers in the context of your specific situation.
I’m happy to provide a quick, no-pressure update tailored to your property type and area.
Numbers used in the charts: January 2026 sales, new listings, inventory, and benchmark prices (Jan 2025 vs Jan 2026) as provided.