If you’ve been following Calgary real estate, you’ve probably noticed how mixed the messaging has been.
Some people talk about bidding wars and homes selling in days. Others say buyers finally have room to negotiate. Both can be true — depending on the community.
Looking at the city as one market no longer works.
Using a full year of Calgary MLS sales data from January 1 to December 31, 2025, this article breaks down:
- where sellers clearly had the upper hand, and
- where buyers had more time, choice, and flexibility.
The goal isn’t to predict the future.
It’s to help you understand where leverage actually existed — and why that matters if you’re thinking about buying or selling.
Why Calgary Feels So Confusing Right Now
One of the biggest frustrations for buyers and sellers is that advice often sounds contradictory.
That’s because city-wide averages hide what’s really happening at the community level.
In 2025:
- Some communities saw homes sell almost as fast as they were listed.
- Others had more listings than buyers, giving people time to think and negotiate.
- Price changes didn’t move evenly across the city.
Once you zoom in by community, the picture becomes much clearer.
Three Simple Signals That Explain Most of the Market
Rather than getting technical, this analysis focuses on three practical questions buyers and sellers already ask.
Want the technical version? Here’s the data behind these three signals.
This article keeps the language simple on purpose, but the rankings are grounded in MLS transaction data from Jan 1–Dec 31, 2025. Below is the “behind the scenes” logic used to interpret each signal.
Signal 1: Are homes selling quickly, or sitting?
This signal is about market tightness — how quickly demand absorbs supply.
-
Days on Market (DOM): average/median
DaysOnMarketfor sold listings in 2025. Lower DOM usually means buyers are acting quickly. -
Months of Inventory (MOI): a supply-pressure measure. In plain terms: “If homes kept selling at the
current pace, how many months would it take to sell what’s available?”
In this dataset, MOI is treated as a useful proxy based on available inventory and the average monthly sales pace, rather than a perfect day-by-day snapshot.
Signal 2: Are homes selling close to asking price?
This signal is about negotiating power. When competition rises, sale prices tend to land closer to (or above) asking.
-
Sale-to-List Ratio:
ClosePrice / ListPrice(typically expressed as a percent). Ratios near 100% suggest a tight negotiation range; consistently above 100% suggests multiple-offer conditions. -
Price-reduction pressure (optional check): comparing
OriginalListPriceto finalListPricecan hint at how often sellers had to adjust before selling.
Signal 3: Have prices already moved up — or not yet?
This signal is about price movement over time — whether a community strengthened through the year or lagged behind.
- In-year price momentum: median sold price in Q4 2025 compared to median sold price in Q1 2025 (a simple “end vs start of year” read).
-
Value context (when relevant): median
ClosePrice / LivingArea(price per square foot) compared to the city-wide median can help identify communities that look relatively expensive or relatively good value.
Note: This post intentionally avoids rental-yield estimates because rental data was not included in the MLS extract used for the analysis.
Methodology Note: For consistency, the analysis focuses on communities with sufficient sales activity in 2025 (at least 30 completed sales) so that the trends shown reflect broader market behaviour rather than isolated results.
1️⃣ Are homes selling quickly, or sitting?
In some areas, there were very few homes available at any given time, and buyers moved quickly. In others, listings built up, giving buyers more options.
This tells us who had more leverage.
2️⃣ Are homes selling close to asking price?
When homes regularly sell at or near asking price, it usually means competition. When they don’t, it often means buyers have more negotiating power.
3️⃣ Have prices already moved up — or not yet?
Some communities saw noticeable price increases during 2025. Others didn’t, even though buyer activity improved later in the year.
That difference matters when deciding whether it’s a better time to buy or sell.
Communities Where Sellers Had the Upper Hand in 2025
These are communities where demand stayed strong throughout the year and supply stayed tight. Sellers generally had more control over pricing and timing.
Top Communities Where Sellers Had an Advantage
- Palliser
- Riverbend
- Lake Bonavista
- Oakridge
- Garrison Woods
- Parkland
- Deer Run
- McKenzie Lake
- Silver Springs
- Tuscany
Why These Stood Out
Palliser
Homes here sold quickly, and there were very few listings available at any given time. Buyers had limited choice, which
helped sellers maintain strong pricing.
Riverbend
Demand remained steady all year, and listings were absorbed quickly. Homes didn’t sit long enough for buyers to gain much
negotiating power.
Lake Bonavista
With a high number of sales and consistent buyer interest, Lake Bonavista showed reliable seller leverage rather than a
few one-off results.
What this means for sellers:
If you own in one of these communities, 2025 data suggests buyers were competing more often than not. For many homeowners,
this created favourable conditions to sell — or at least to explore timing and pricing carefully.
Communities Where Buyers Had More Leverage in 2025
These areas weren’t weak markets — they were more balanced.
Buyers generally had:
- more listings to choose from,
- more time to make decisions,
- and more opportunity to negotiate.
Top Communities Where Buyers Had More Breathing Room
- Downtown Commercial Core
- Downtown West End
- Erlton
- Point McKay
- Crescent Heights
- Walden
- New Brighton
- Windsor Park
- Glenbrook
- Edgemont
Why These Are Worth Watching
Downtown Commercial Core
Prices didn’t rise as much during the year, but buyer activity picked up later in 2025. That combination often points to
improving demand before prices fully respond.
Downtown West End
A similar story: more balance, more choice, and pricing that didn’t keep pace with stronger parts of the city.
Erlton
Erlton stood out for having softer pricing alongside signs of improving buyer interest — the kind of environment where
careful buyers can take their time.
What this means for buyers:
These communities offered more flexibility. Buyers weren’t forced into rushed decisions and often had room to negotiate on
price or conditions.
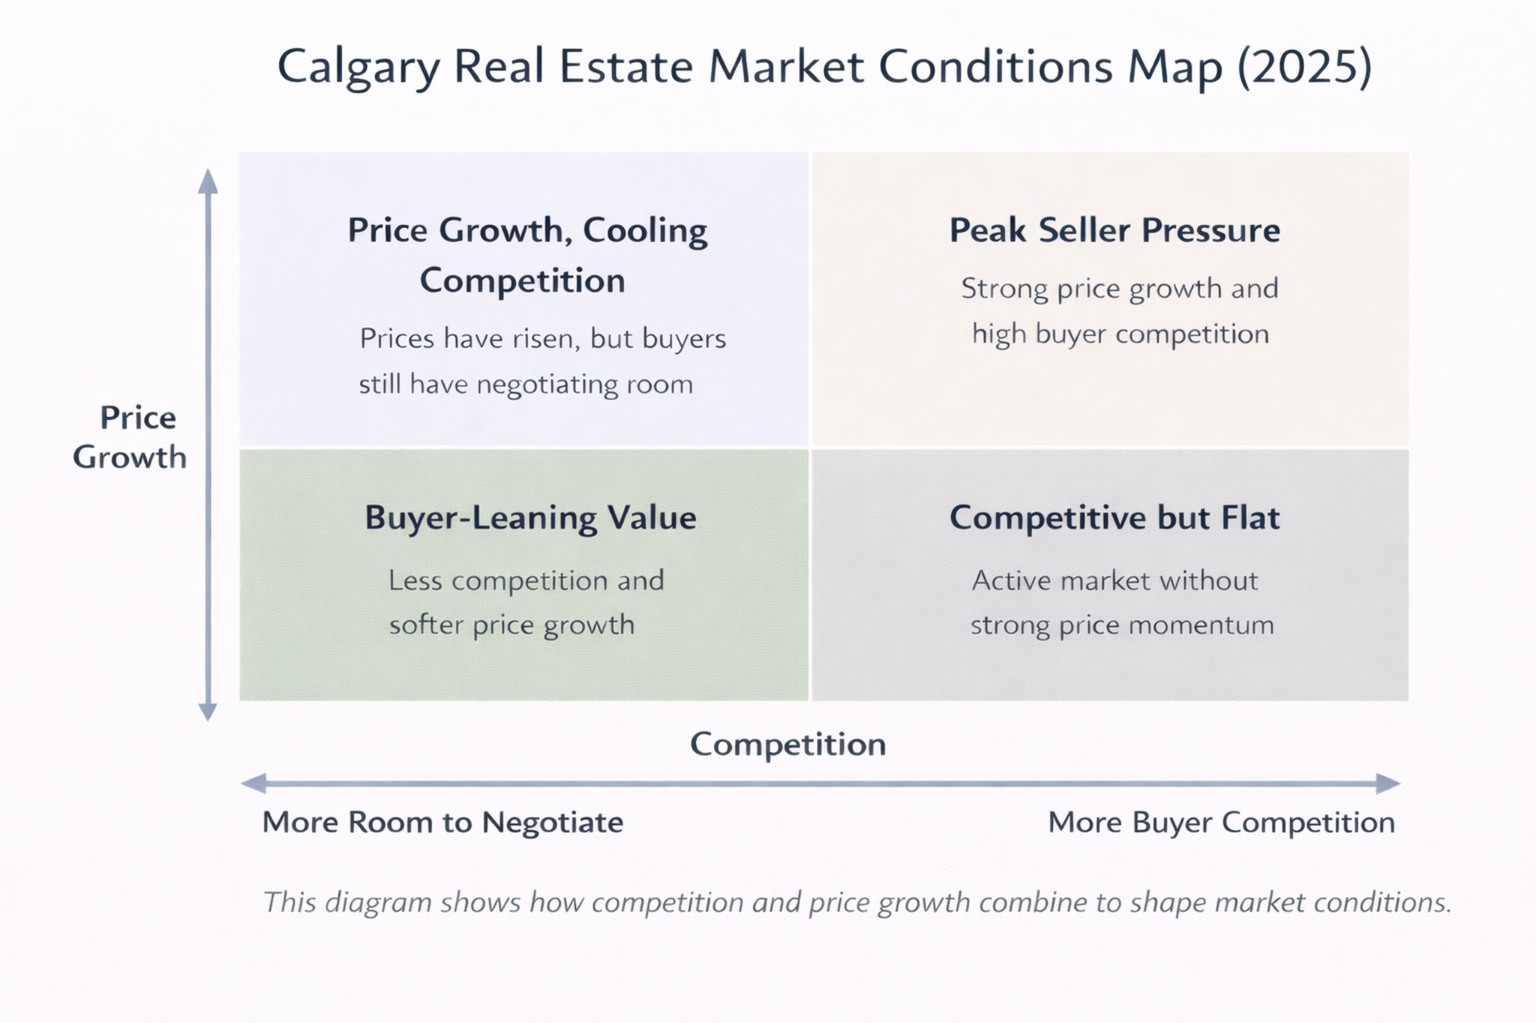
A Simple Way to Think About the Market
Rather than thinking in technical terms, it helps to look at communities through two simple lenses: how competitive they were, and whether prices had already moved.
When you combine those two ideas, most communities fall into one of four broad patterns as identified in the Real Estate Market Conditions map:
- Peak seller pressure — strong price growth combined with heavy competition, making conditions toughest for buyers and most favourable for sellers.
- Price growth with cooling competition — prices rose earlier, but buyer pressure eased, giving buyers some negotiating room despite higher values.
- Buyer-leaning value — softer price growth and less competition, creating more choice and flexibility for buyers.
- Competitive but flat — active markets where homes still sold, but without meaningful price acceleration.
None of these categories are “good” or “bad” on their own. The right fit depends on whether you’re buying, selling, or simply planning your next move.
A Quick Note on Property Type (This Matters)
Even within the same community, different property types can behave very differently.
In 2025:
- Detached homes often sold faster than condos in the same area.
- Townhomes led demand in some family-oriented communities.
- Higher-priced homes sometimes slowed even when entry-level homes stayed active.
That’s why community trends are the starting point — not the full story.
When working with clients, property type, price range, and condition still matter a great deal. This is where a more detailed, property-specific conversation becomes important.
What This Means If You’re Thinking About Buying or Selling
If you’re considering selling:
Where you live in the city can influence how much leverage you have. Some communities still favour sellers more than
others, even in the same overall market.
If you’re considering buying:
Not every area is competitive. Some communities give buyers time, choice, and negotiating room — which can make a big
difference to comfort and outcomes.
A Final Thought
There’s no single “right” move in Calgary real estate right now.
But understanding how your community has been behaving puts you in a better position to decide what makes sense for you.
If you’re curious how your specific neighbourhood — and property type — fits into this picture, I’m always happy to walk through it with you.
Want a data-backed read on your community? You can reach me any time.