Keystone Hills Detached Market Update – November 15, 2025
Market Highlights (as of November 15, 2025)
-
Average Sold Price: Over the past 12 months, detached homes in Keystone Hills have achieved an average sold price of about $0.
-
Average Days on Market: The average time on market over the period was around 0 days, which reflects a brisk time on market, where well-prepared listings find buyers quickly.
-
Odds of Selling: Combining completed sales and current pendings, the likelihood of a listing selling for a detached listing in Keystone Hills over this window comes in at roughly 0%, based on 0 sold, 0 pending, and 0 that did not sell.
-
Monthly Selling Rate: A total of 0 sales over the past year translates into a monthly selling rate of roughly 0 detached sales per month in Keystone Hills.
-
Months of Inventory: With 2 active listings at the time of this snapshot and the current selling rate, months of inventory sits near 0 months, indicating that supply feels lean, so serious buyers often focus closely when the right home appears.
Time to Sell
The Time to Sell chart plots individual detached sales in Keystone Hills by days on market and sold price over the past 12 months, from 2024-11-15 to 2025-11-15. Each point represents one sold listing, with days on market on the horizontal axis and sold price on the vertical axis, plus reference lines showing the average sold price and a typical time on market for this segment.
-
Looking at the past year, detached homes in this area have usually taken around 0 days to reach a firm sale. That’s a useful timeline to keep in mind when you’re planning your own move.
-
Sales that completed in less than about 0 days sit on the faster side of the chart and often reflect well-prepared listings that were aligned with recent pricing, while sales that took longer than roughly 0 days illustrate cases where extra time was needed before the right buyer and price match came together.
-
Across this period, the average sold price for detached homes in Keystone Hills has been near $0, and points that sit well to the right of the typical days-on-market line highlight situations where pricing, condition, or more specialized features required additional exposure before a firm sale.
Odds of Selling
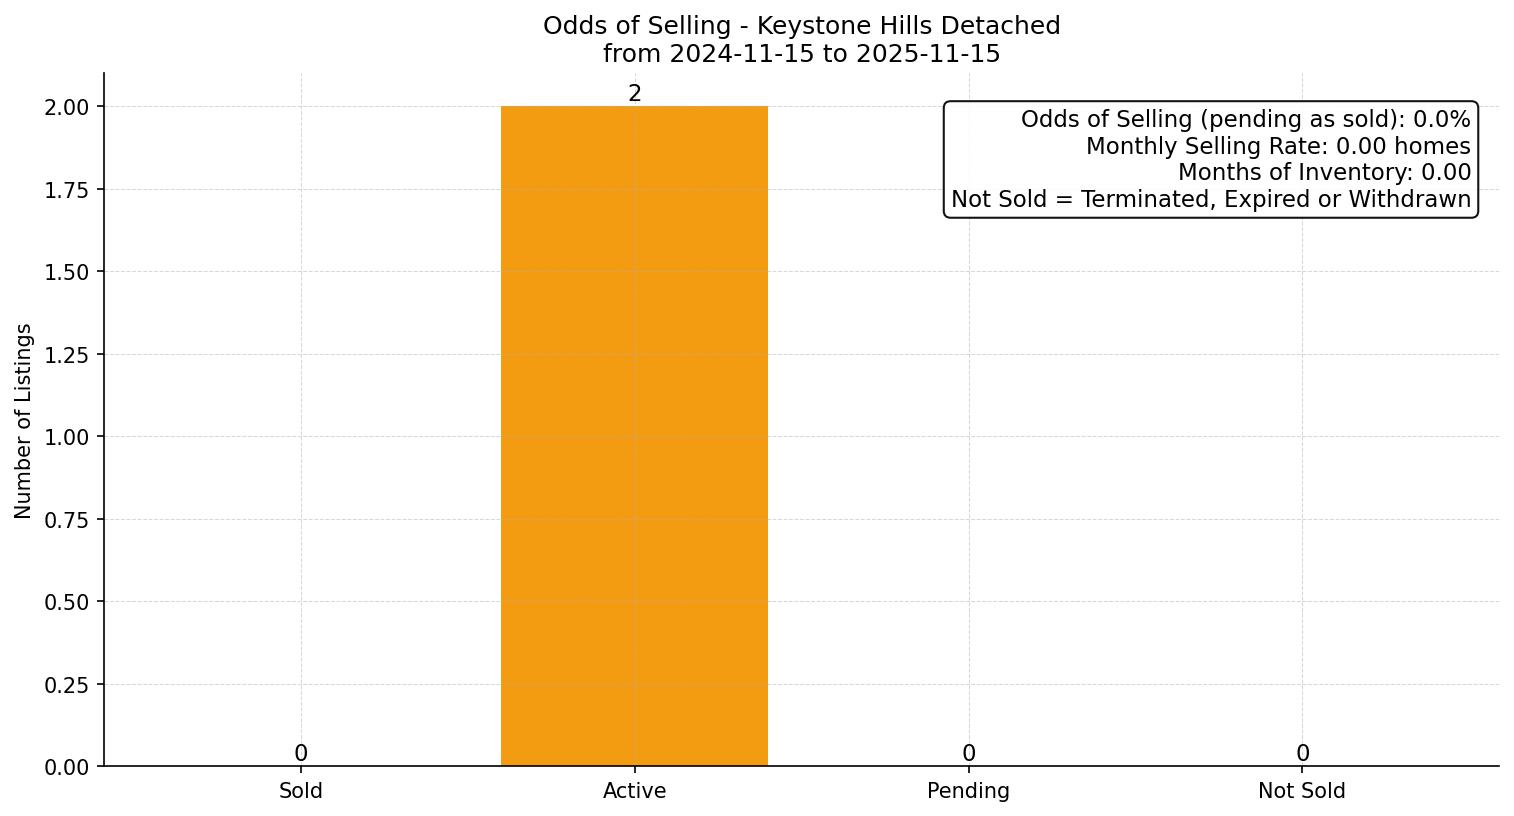
The Odds of Selling chart summarizes how many detached listings in Keystone Hills have sold, how many are still on the market, and how many were removed without a completed sale over the past 12 months, from 2024-11-15 to 2025-11-15. It also rolls those counts into an overall estimate of the percentage of listings that ultimately reach a firm sale.
-
Odds of Selling: Looking across these 12 months, 0 detached listings in Keystone Hills have successfully sold and 0 are part-way there, with 2 still on the market and 0 leaving the market unsold. Put simply, roughly 0% of listings have been making it all the way to a firm deal.
-
Monthly Selling Rate: When you smooth the results across the past 12 months, it comes to around 0 completed detached sales per month, highlighting the underlying pace of demand in this segment.
-
With around 0 months of inventory derived from 2 active listings and the recent selling rate, supply feels lean, so serious buyers often focus closely when the right home appears
-
In this context, “not sold” captures listings that were terminated, expired, or withdrawn without reaching a firm sale, which helps distinguish between properties that successfully completed the moving process and those that left the market for other reasons.
Buying Pattern
The Buying Pattern chart shows how many detached sales in Keystone Hills were completed in each of the last 12 months, including 11 full months plus the current month-to-date, so you can see how activity has moved through the year between 2024-11-15 and 2025-11-15.
-
Sales have been relatively modest across the past 12 months, with no single month standing out as a clear high point in the closed-sale counts.
-
Outside of the peak months, most of the remaining months cluster in a mid-range band, indicating that closed-sale counts have been fairly steady from one month to the next.
-
Closed-sale counts have been quite consistent from month to month over this period, with each of the 12 months landing near the same level and adding up to 0 completed sales overall—broadly in line with the average of about 0 sales per month in this segment.
Price vs. Square Footage
The Price vs. Square Footage chart focuses on the last three months of detached sales in Keystone Hills, plotting each sale by interior size on the horizontal axis and sold price on the vertical axis. A trend line is overlaid to summarize how sale prices have tended to move as square footage changes in this recent sample.
-
Recent closed detached sales in this view span from around - sq. ft. through to roughly - sq. ft., and within that range the trend line suggests a softer relationship where the recent sales sample shows only a limited directional pattern between size and price.
-
Most recent detached sales here have clustered in the core size range that many local buyers favour. That cluster helps show how extra space has been priced in real offers, rather than just on paper. The picture is based on roughly 0 sales from the last three months.
-
Taken together with the average sold price of roughly $0 over the full 12-month window, the chart can be used as a directional guide: you can locate a home's square footage on the horizontal axis, follow it up toward the trend line, and get a sense of where similar recent sales have been concentrating on the price scale.
Key Takeaways
-
Listing outcomes: There have not been enough recently listed and closed properties to provide a meaningful read on how often listings are converting to sales versus expiring. In these cases, it becomes especially important to rely on hand-picked comparables and hyper-local context.
-
Seasonal rhythm: With sales distributed relatively evenly across the 12-month window, the charts suggest that timing alone has not been the dominant driver of outcomes in this segment.
-
Size and pricing: Even without a large sample of recent sales by square footage, the Price vs. Square Footage chart is a useful directional tool when viewed alongside individual comparables that match closely on size and key features.
Other Property Types in Keystone Hills
Want to see the market trend for other property types in Keystone Hills?
Considering a Move?
If Keystone Hills is on your radar and you’d like a grounded take on how the detached market is behaving right now, I can help you sort out your best next steps.
Buying: I’ll help you zero in on the right opportunities, compare the numbers, and move with confidence in the Keystone Hills detached market.
Selling: I’ll help you read the demand signals, tune pricing properly, and highlight the features that move buyers in this part of Keystone Hills.
Want clear guidance shaped around your goals and timeline?
Let’s talk.