
An examination of successful and unsuccessful apartment listings in Beltline, Bridgeland/Riverside, Mission and Eau Claire, October 2025–September 2026.
Two apartments offered for sale in Calgary's inner city can have different outcomes. One attracts a buyer and closes; another is terminated or expires. Understanding those differences requires looking beyond the number of sales to the listings that did not result in a transaction — and what happened when some of those apartments returned to the market.
Across Beltline, Bridgeland/Riverside, Mission and Eau Claire, 822 apartment listings ended in a sale and 962 ended without one (expired, terminated or withdrawn) during the 12 months ending September 30, 2026. Another 379 records were Active or Pending and are excluded from this comparison.
Of the 1,784 apartment listings that either sold, expired, were terminated or were withdrawn, 46.1% resulted in a sale. An apartment that does not sell during one listing period may subsequently be relisted and sold.
| Community | Sold | Ended without a sale | Sold share |
|---|---|---|---|
| Bridgeland/Riverside | 90 | 63 | 58.8% |
| Beltline | 578 | 700 | 45.2% |
| Mission | 84 | 107 | 44.0% |
| Eau Claire | 70 | 92 | 43.2% |
| Total | 822 | 962 | 46.1% |
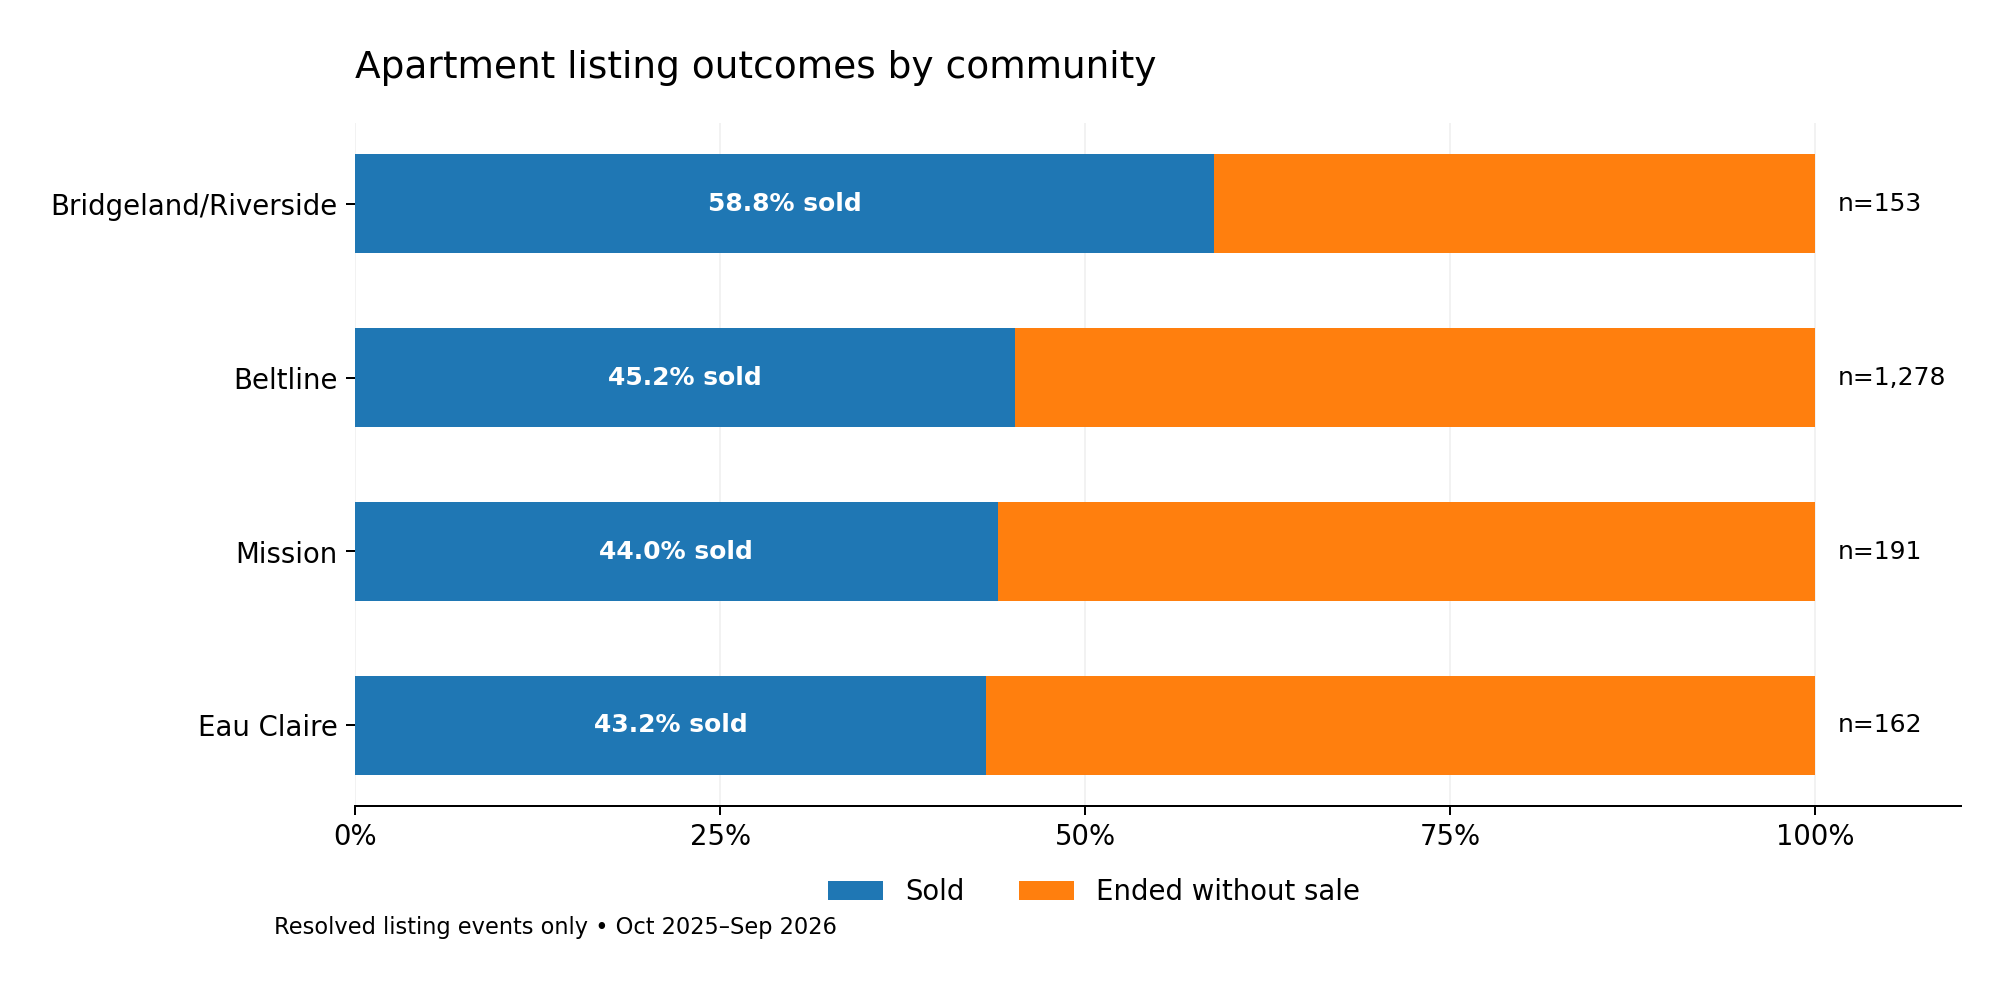
Bridgeland/Riverside stood apart: 58.8% of its resolved listings sold, roughly 14–16 percentage points above the other three communities. It was the only community in this comparison where sales outnumbered unsuccessful listing events.
Beltline accounted for 70% of the sales and 73% of unsuccessful listing events. Its large number of unsuccessful listings therefore needs to be understood alongside its much larger market. High activity and a high sold share are not the same measure, and the raw number of failed attempts alone does not make Beltline the weakest market.
Beltline, Mission and Eau Claire recorded similar percentages of listings that sold, ranging from 43.2% to 45.2%. The differences among these three communities were relatively small.
An unsuccessful listing is one that expired, was terminated or was withdrawn without selling. That does not necessarily mean the apartment never sold.
During the 12-month study period, 204 apartment addresses had an unsuccessful listing followed by a later listing that sold. Those addresses accounted for 250 unsuccessful listing attempts before their recorded sales. This shows why the outcome of one listing does not tell us the entire selling history of a property.
The asking-price changes were also notable. Of those 204 apartments, 175 (86%) had a lower final asking price on the later successful listing than on their preceding unsuccessful listing. Another 24 had the same final asking price, while five had a higher one.
The median change between those two final asking prices was a 4.2% reduction.
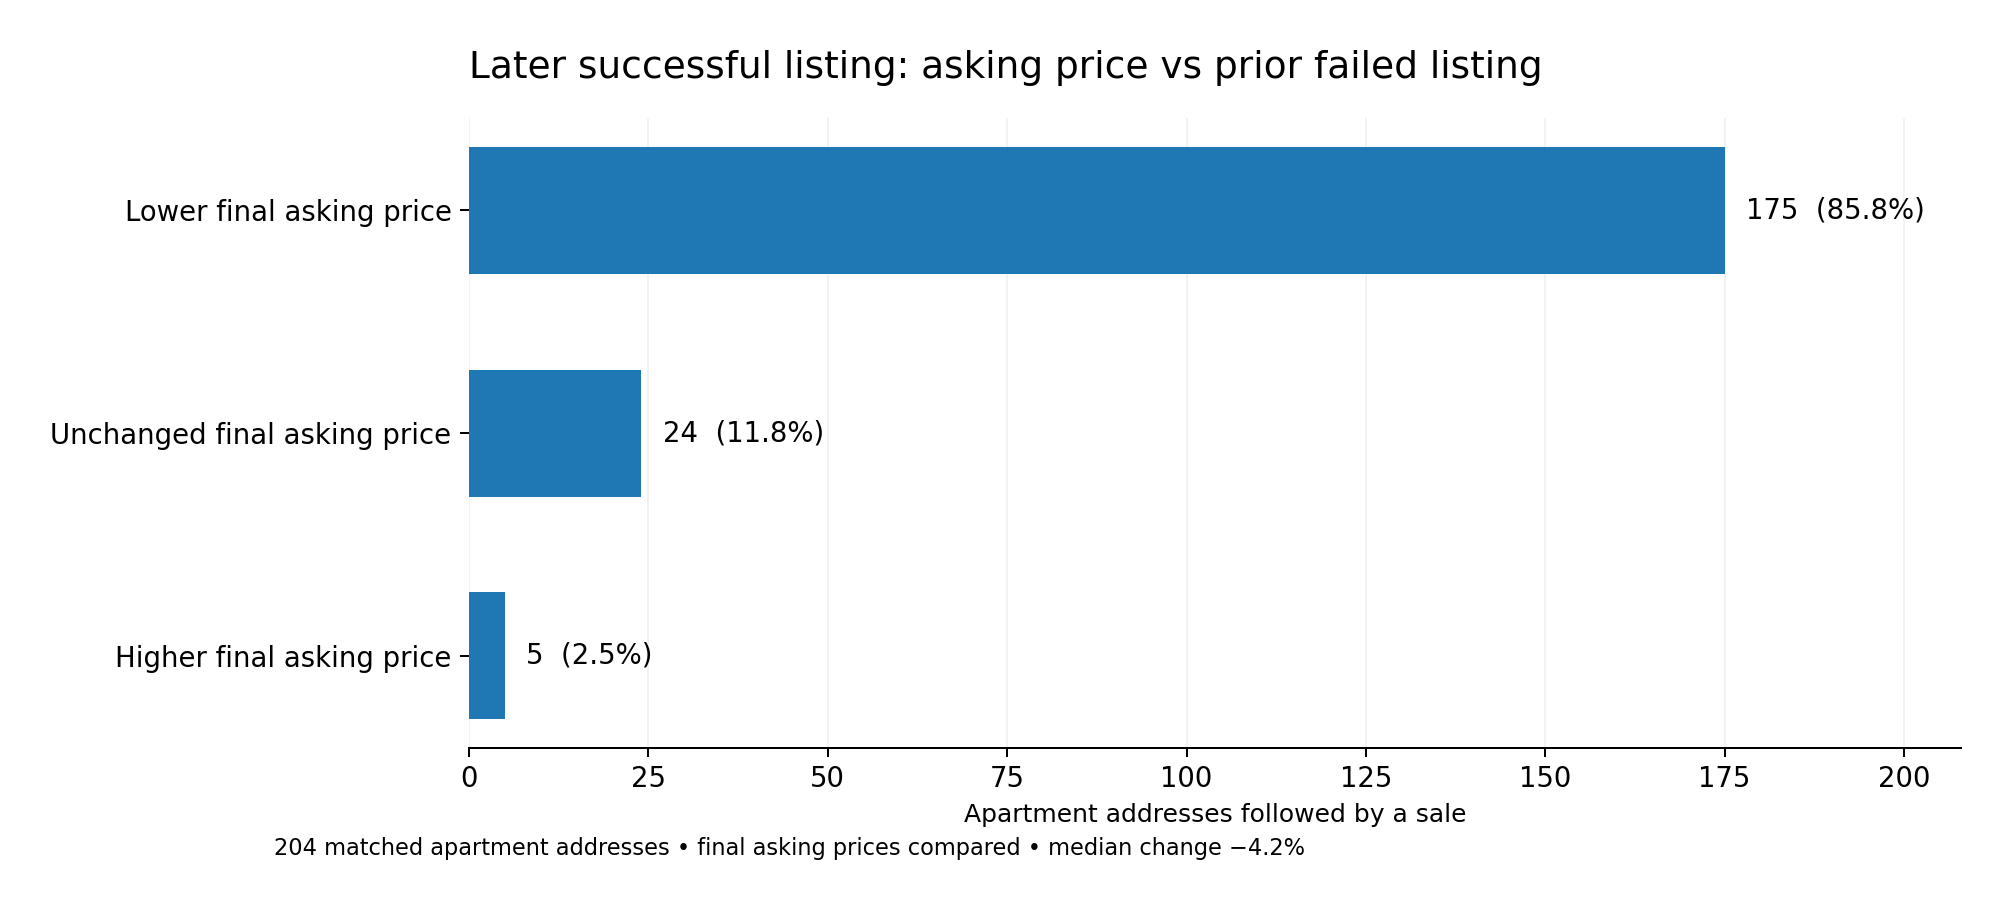
The price changes were frequently associated with a later sale, but they do not prove that the lower asking price caused it. Timing, presentation and other circumstances could also have changed between listing attempts.
Reducing the asking price did not always result in a sale. Of the 962 listings that expired, were terminated or were withdrawn, 535 (56%) had a lower final asking price than their original asking price. This suggests that while competitive pricing is important, reducing the asking price alone does not guarantee a sale.
Actual closing prices tell us where buyers and sellers reached agreement. For listings that did not sell, the comparable recorded observation is the final asking price, not a transaction price.
| Price range | Sold at closing price | Ended without sale at final asking price |
|---|---|---|
| Under $250,000 | 175 | 200 |
| $250,000–$349,999 | 272 | 341 |
| $350,000–$449,999 | 215 | 209 |
| $450,000–$599,999 | 84 | 123 |
| $600,000–$799,999 | 27 | 39 |
| $800,000+ | 49 | 50 |
| Total | 822 | 962 |
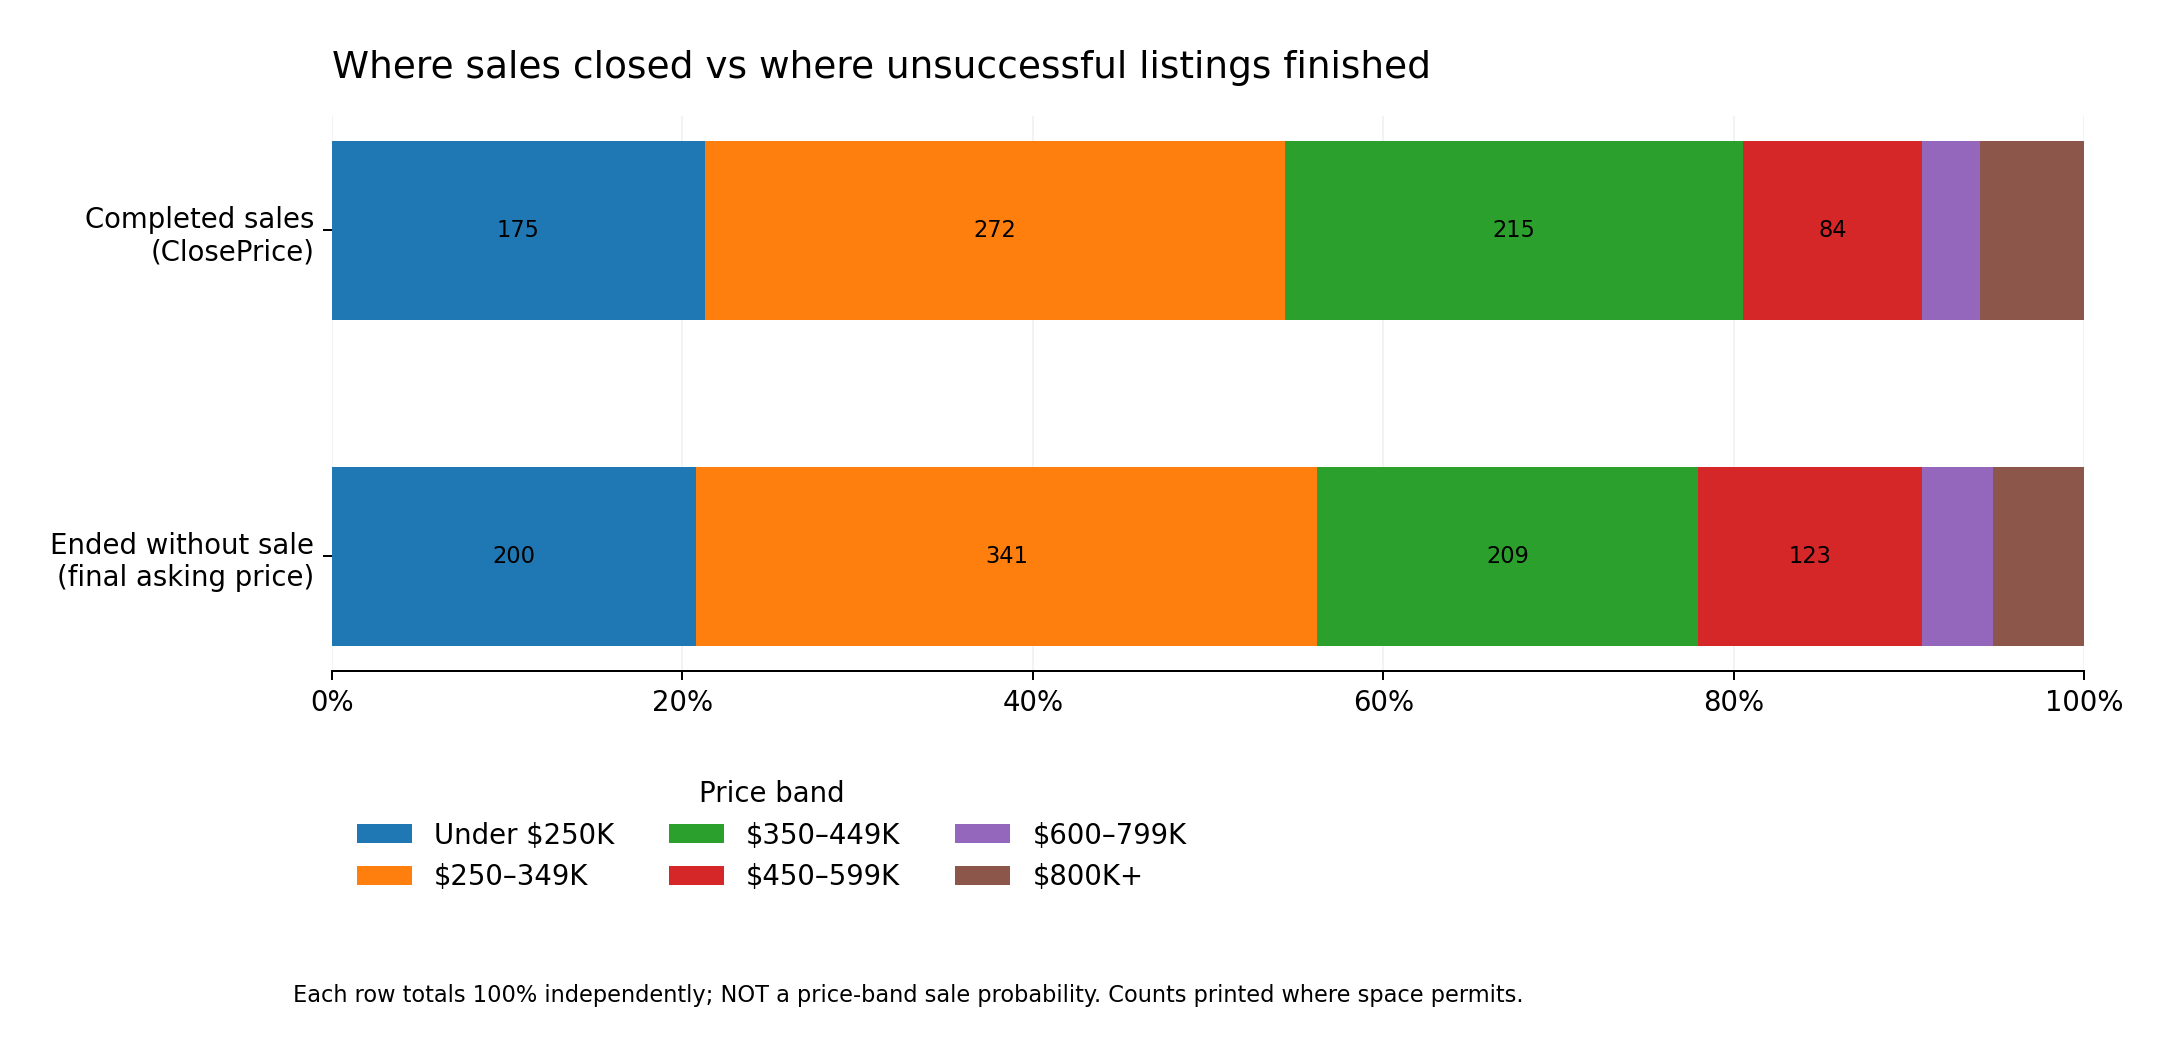
Nearly 81% of completed sales closed below $450,000. In particular, 487 sales — 59% of the total — closed between $250,000 and $449,999. Unsuccessful listing events were also concentrated in the lower and middle asking-price ranges.
Among the 822 completed sales, 749 closed below their final asking price. The median sale closed approximately 3.2% below that asking price. This quantifies the difference between what sellers last asked and what buyers ultimately paid; it does not establish whether an individual property was priced appropriately.
These are two separate price distributions, not a comparison of success rates within the same initial asking-price cohort. Community and building differences provide the more useful context.
Bridgeland/Riverside recorded 90 sales against 63 unsuccessful listing events. Its 58.8% sold share was the highest of the four communities, though the sample of 153 resolved listings was much smaller than Beltline's.
Forty-six of its 90 sales closed between $350,000 and $599,999, including 34 in the $350,000–$449,999 range. Its median closing price was $370,000. That middle-market concentration differs from Beltline, where a larger share of completed sales closed below $350,000.
Bridgeland/Riverside also had 16 addresses with an unsuccessful listing followed by a later sale in the observation window. The combination of stronger overall outcomes and evidence of subsequent successful listings suggests a market where the position of an individual apartment can make a difference. The reason for that difference is not established by community-level figures alone. The mix of apartments offered, their condition and how they were positioned against competing units are important matters for property-level comparison.
Beltline recorded 578 of the 822 sales, alongside 700 listing attempts that ended without a sale. Its 45.2% sold share was close to Mission's and Eau Claire's, despite the much greater transaction volume.
Its completed transactions were concentrated below $450,000: 499 of 578 sales, or 86%, closed in that range. The median closing price was $312,750. Beltline also accounted for 149 of the 204 addresses where an unsuccessful listing was followed by a sale within the study period.
Beltline had both substantial buyer activity and many unsuccessful listing attempts. Its 149 addresses with an unsuccessful listing followed by a later sale show why examining an apartment’s listing history gives a fuller picture than treating an expired or terminated listing as the final outcome.
Mission recorded 84 sales and 107 unsuccessful listing events, for a 44.0% sold share — close to Beltline's 45.2%.
Its median closing price was $358,750. Sales took place across a range of budgets: 25 closed between $250,000 and $349,999, 19 between $350,000 and $449,999, and 9 at $800,000 or more. Among unsuccessful listing events, 35 ended with final asking prices below $250,000.
Mission's closing-price pattern differs from both Beltline's lower-price concentration and Eau Claire's higher-end activity. For an individual Mission apartment, building condition, monthly condo fees and unit characteristics may matter more than its position within a broad community price range.
Eau Claire recorded 70 sales and 92 unsuccessful listing events. Its 43.2% sold share was only about two percentage points below Beltline, so the four-community ranking should not be overstated.
Its transaction-price distribution, however, was distinctive. Twenty-eight of Eau Claire's 70 sales (40%) closed for $800,000 or more. Those 28 transactions accounted for 57% of all $800,000-plus apartment sales in the four-community analysis. Mission recorded 9 such sales and Beltline 12, despite both having more total sales than Eau Claire.
At the same time, 29 Eau Claire listings ended unsuccessfully with final asking prices of at least $800,000. A substantial high-end transaction market therefore coexisted with high-end listing attempts that did not complete. That contrast is a reason to evaluate Eau Claire apartments against properties with comparable buildings, views, floor plans and amenities rather than treating the community as one uniform market.
| Community | Median DOM, sold | Median DOM, ended without sale |
|---|---|---|
| Beltline | 38 | 83 |
| Bridgeland/Riverside | 43.5 | 84 |
| Mission | 38 | 73 |
| Eau Claire | 44.5 | 86.5 |
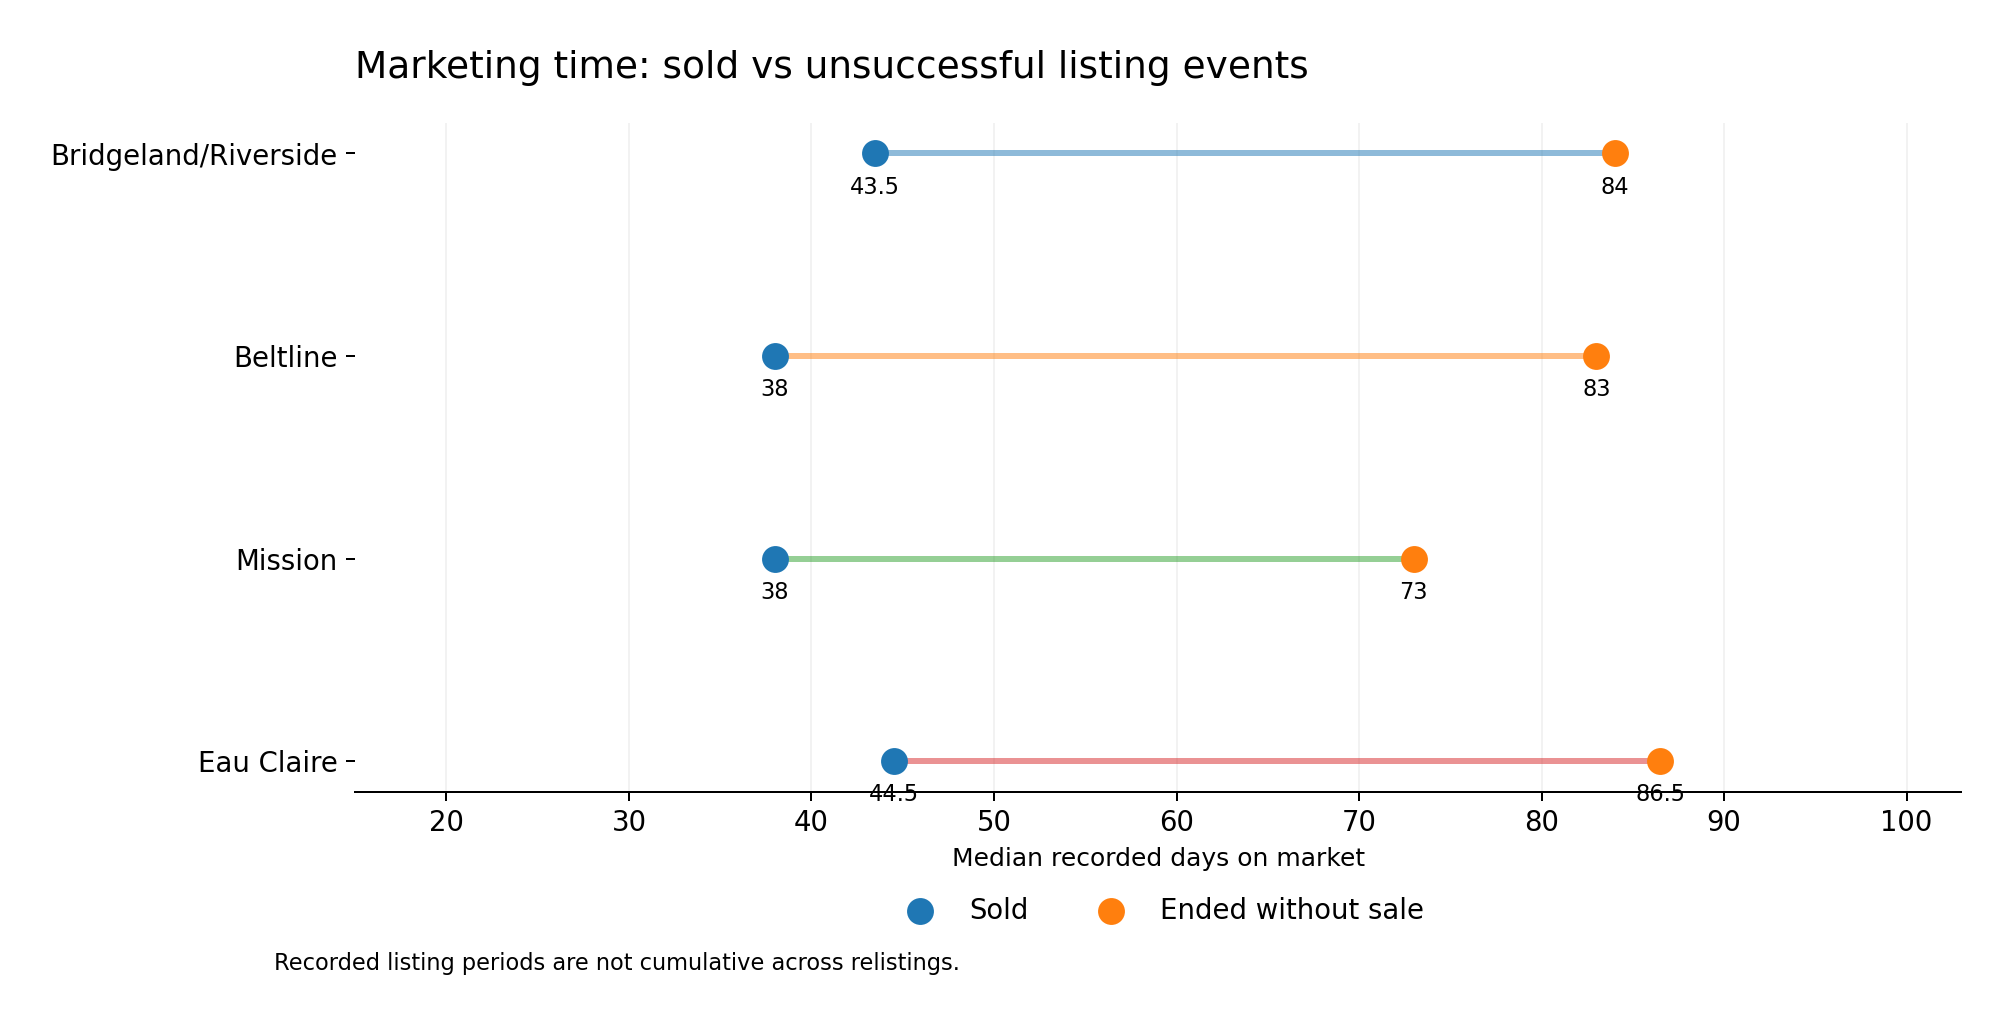
Across the four communities, sold listing events recorded a median 40 days on market, compared with 83 days for those ending without a sale. Among unsuccessful outcomes, expired listings recorded a median 93.5 days while terminated listings recorded 58 days — another reminder that the unsuccessful category contains different circumstances.
These are recorded listing periods, not necessarily the total time an apartment was marketed across multiple MLS listings. The longer median marketing time is associated with unsuccessful outcomes; it is not proof that time itself caused them.
For a seller, the useful question is whether competing apartments are selling while their own listing is not attracting comparable interest. That comparison may indicate a need to reassess pricing, presentation or the property's position among alternatives, rather than relying on a universal 30- or 60-day rule.
For buyers, the analysis identifies differences in the competitive environment but not automatic negotiating leverage. A community with many unsuccessful listings can still contain individual apartments that are appropriately priced and attract strong interest. Recent completed sales in the same building, along with current competing inventory, remain the strongest starting points.
For apartment sellers, recent sales of comparable units in their building, alongside the asking prices of competing apartments, provide a better foundation for establishing an asking price than community-wide counts of sales or unsuccessful listings. Listing history matters too: some unsuccessful attempts were followed by sales, often with a lower final asking price, while other unsuccessful listings had already been reduced. A price reduction alone did not guarantee a sale.
The four communities do not behave identically. Bridgeland/Riverside had the strongest overall resolved-listing sold share. Beltline had the largest numbers of both successful and unsuccessful listing attempts. Mission's sales covered a broad range of prices, while Eau Claire accounted for a disproportionate share of higher-priced transactions. Across all four communities, marketing duration and relisting histories add context that sales counts alone cannot provide.
The central finding is not that most inner-city apartments never sell. It is that many individual listing attempts end without a transaction, while outcomes differ by community, competitive position and marketing history. Understanding that distinction helps buyers and sellers interpret the market more accurately.
Explore Calgary apartments and market conditions. Browse Calgary Apartment Homes for Sale or review the latest Calgary Apartment Market Report for additional market context.
The analysis uses residential MLS records classified as Apartment in Beltline, Bridgeland/Riverside, Mission and Eau Claire, with StatusContractualSearchDate from October 1, 2025 through September 30, 2026. The 2,163 filtered records comprise 822 Sold, 561 Terminated, 400 Expired, 1 Withdrawn, 357 Active and 22 Pending. Sold share divides Sold by Sold plus Terminated, Expired and Withdrawn; Active and Pending are excluded.
Each MLS ListingId is a separate listing event. The same apartment can appear more than once. Relisting observations match subsequent sales by normalized community and address, with the unsuccessful event dated before the sale; they do not establish an ultimate sale probability or causal effect from repricing. Each address is counted once in the 204-address follow-up analysis, using the most recent unsuccessful event preceding a later recorded sale. This analysis is limited to what occurred inside the 12-month observation window.
Completed sales are assigned to price ranges using ClosePrice. Unsuccessful listing events use final recorded CurrentPrice. The two distributions are never combined into price-specific selling rates. For the follow-up comparison, the later successful listing's final asking price is ListPrice (not ClosePrice). Original-to-final asking-price changes compare OriginalListPrice with the final asking-price field appropriate to each outcome. Days on market are taken as recorded and are not accumulated across relistings. These figures describe listing records in the supplied dataset rather than official CREB® market totals or the ultimate outcomes of unique properties.