Storybook Village Row Homes Market Update – May 4, 2026
For owners and buyers watching Storybook Village in Ranchlands, this market update reviews recent row home activity through May 4, 2026. The charts look at how long units have taken to sell, the share of listings that successfully sold, when sales occurred during the year, and how recent sold prices relate to above grade square footage.
Storybook Village is a small, low-turnover complex, so the numbers should be read as a micro-market snapshot rather than a broad Ranchlands trend. In a small sample, one or two sales can materially change the averages, but the data still gives useful context for pricing, timing, and buyer demand.
Market Highlights
Time to Sell
Odds of Selling
Buying Pattern
Price vs. Square Footage
Key Takeaways
Considering a Move?
Market Highlights (as of May 4, 2026)
-
Average Sold Price: Over the past 12 months, Storybook Village row homes recorded an average sold price of about $254,300.
-
Average Days on Market: The average time to sell was about 30 days, pointing to a steady pace where well-positioned listings can move without sitting for an extended period.
-
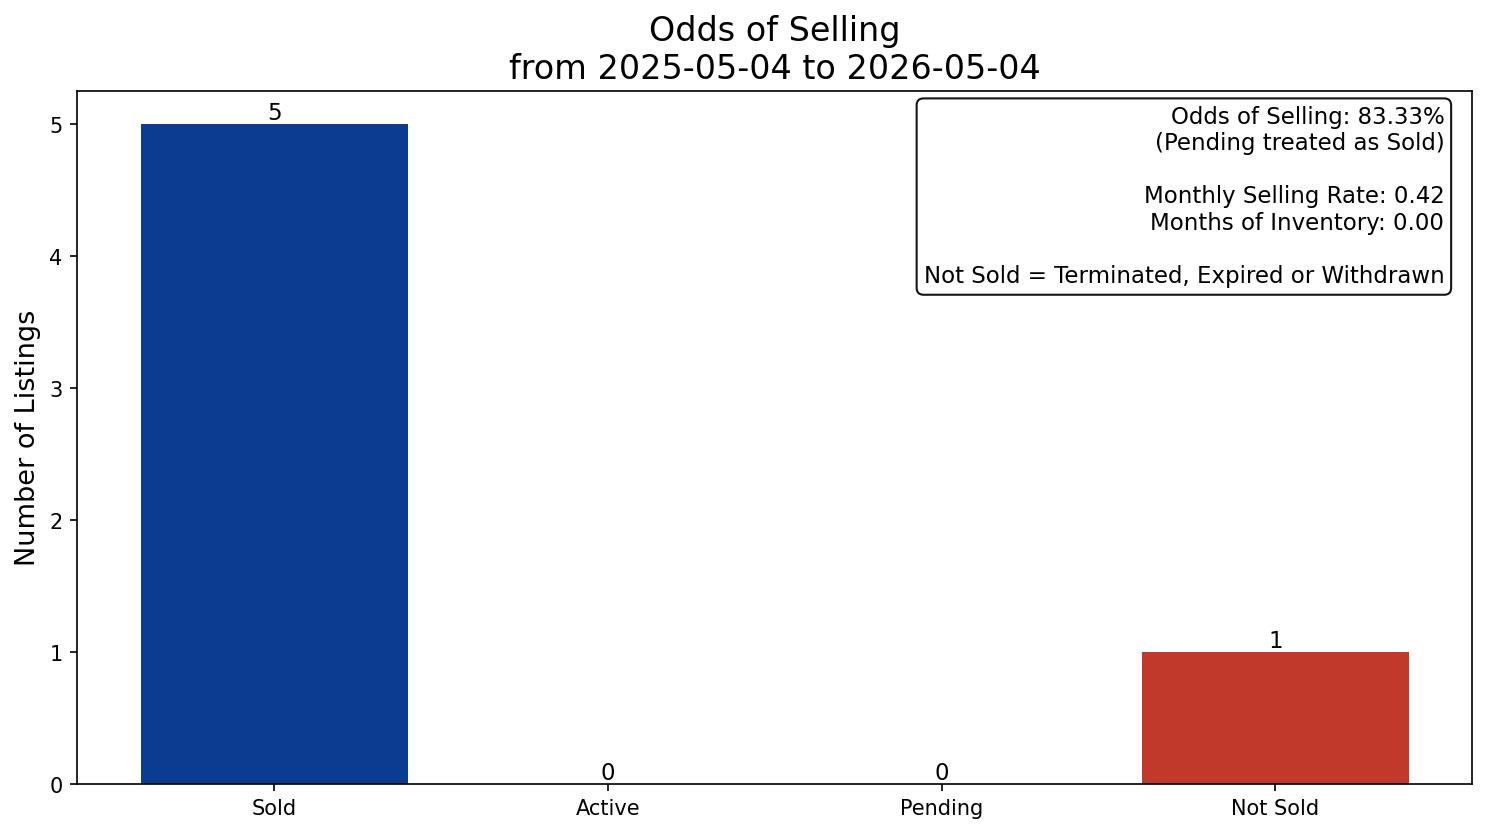
Odds of Selling: With 5 sold listings, 0 pending listings, 0 active listings, and 1 not sold listing, the odds of selling worked out to about 83.33%.
-
Monthly Selling Rate: The complex has been selling at roughly 0.42 homes per month, or about one sale every 2.4 months.
-
Months of Inventory: With 0 active listings and a monthly selling rate of 0.42, months of inventory calculates to 0.00. That reflects a lack of current supply, not a high-volume market.
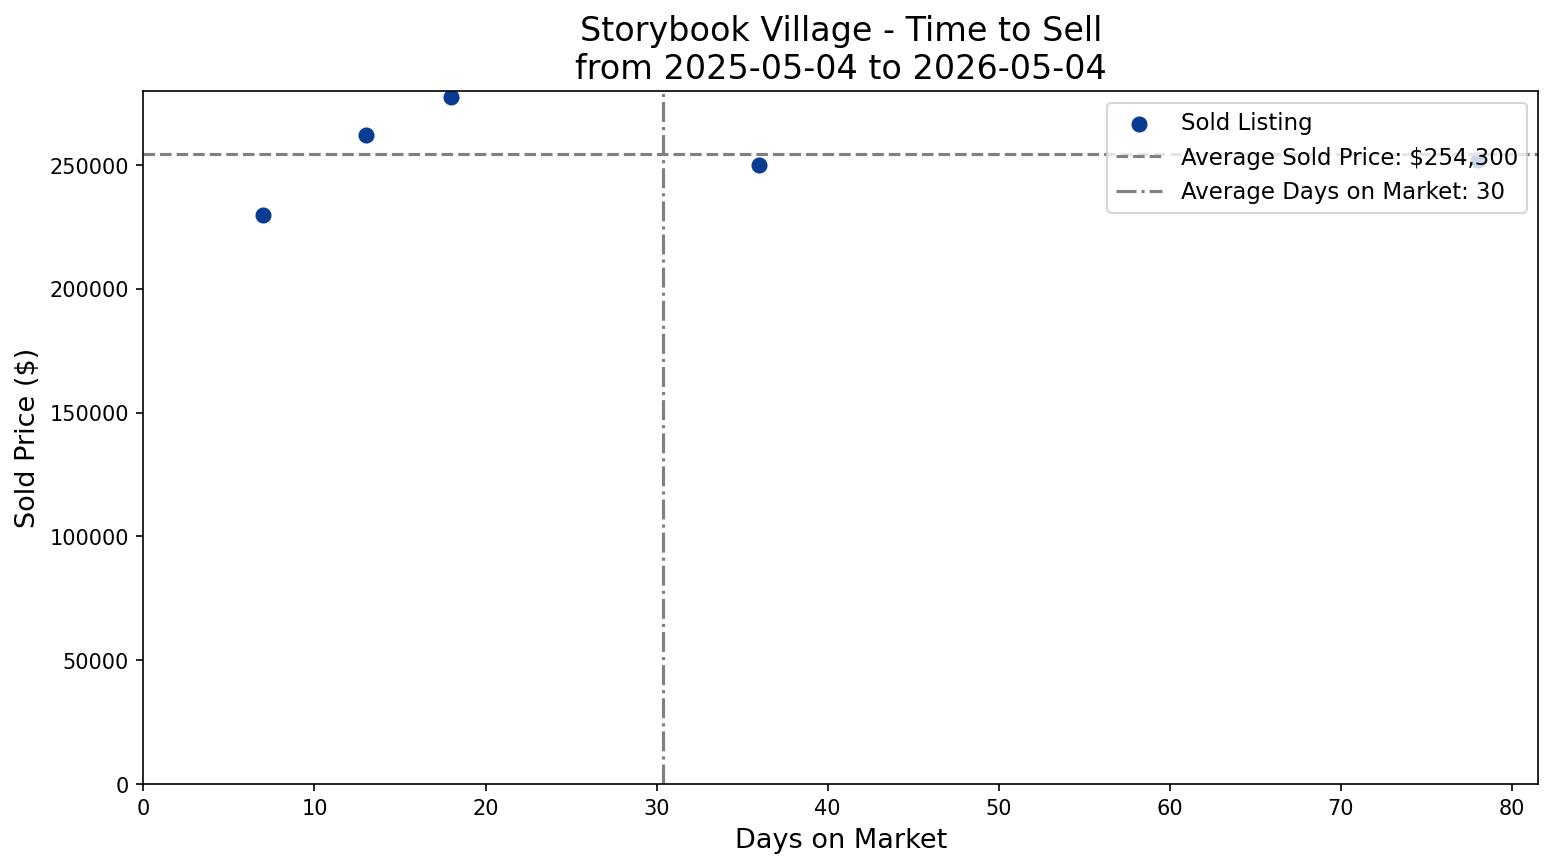
Time to Sell
The Time to Sell chart plots Storybook Village sales from 2025-05-04 to 2026-05-04 by days on market and sold price. The average sold price was $254,300, while the average time on market was 30 days.
-
An average of 30 days on market suggests a healthy, balanced pace: not stagnant, but not so fast that buyers have no time to compare options.
-
The average sold price of $254,300 places this segment in a more affordable Calgary ownership range, which can attract first-time buyers, investors, and budget-conscious downsizers.
-
Because the units are relatively comparable, pricing precision likely matters. Listings that are aligned with recent sales are more likely to sell near the average timeframe, while overpricing can quickly add days on market.
Odds of Selling
The Odds of Selling chart compares sold, active, pending, and not sold listings. In this report, pending listings are treated as sold for the calculation, while not sold means terminated, expired, or withdrawn.
-
The 83.33% odds of selling looks strong, but it is driven by a small sample: 5 sales against only 1 not sold listing.
-
With 0 active listings and 0 pending listings, there is currently no direct supply in the complex. A new listing would enter with little immediate competition.
-
The monthly selling rate of 0.42 shows that demand exists, but turnover is thin. This is an inventory-constrained micro-market, not a high-velocity market.
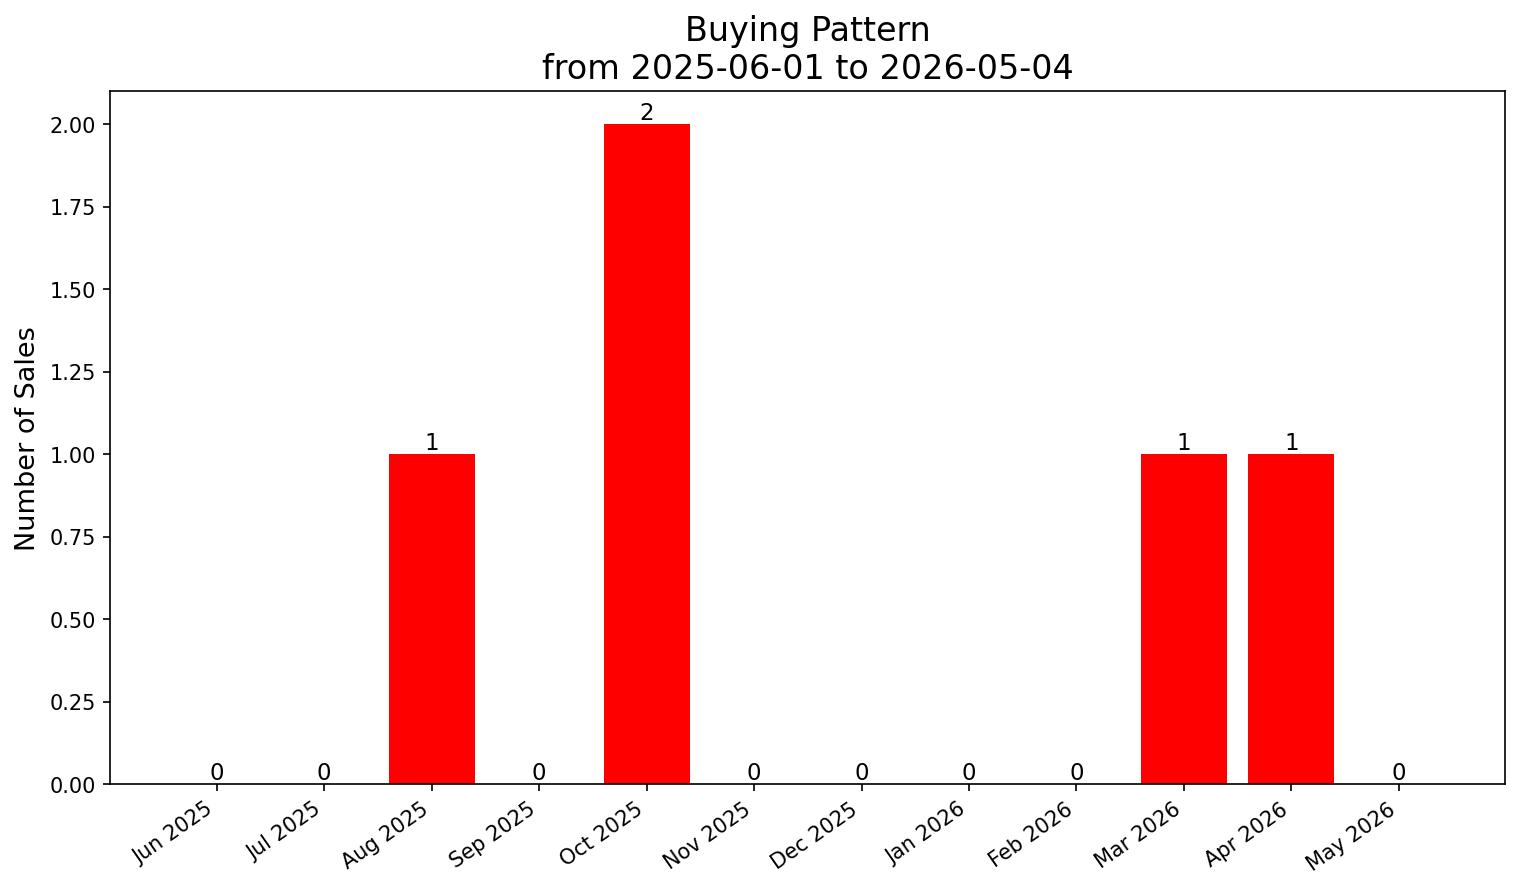
Buying Pattern
The Buying Pattern chart shows closed sales by month from 2025-06-01 to 2026-05-04, covering the previous 11 full months plus the current month-to-date.
-
Sales were sporadic rather than seasonal. Only 4 of the 12 displayed months recorded any sales, while 8 months had no sales.
-
October 2025 was the only true peak month, with 2 sales. The other active months each recorded just 1 sale.
-
Because volume is low, the “top 6 months” should be read carefully. In this type of complex, one sale can make a month appear active even when the broader pattern is still low turnover.
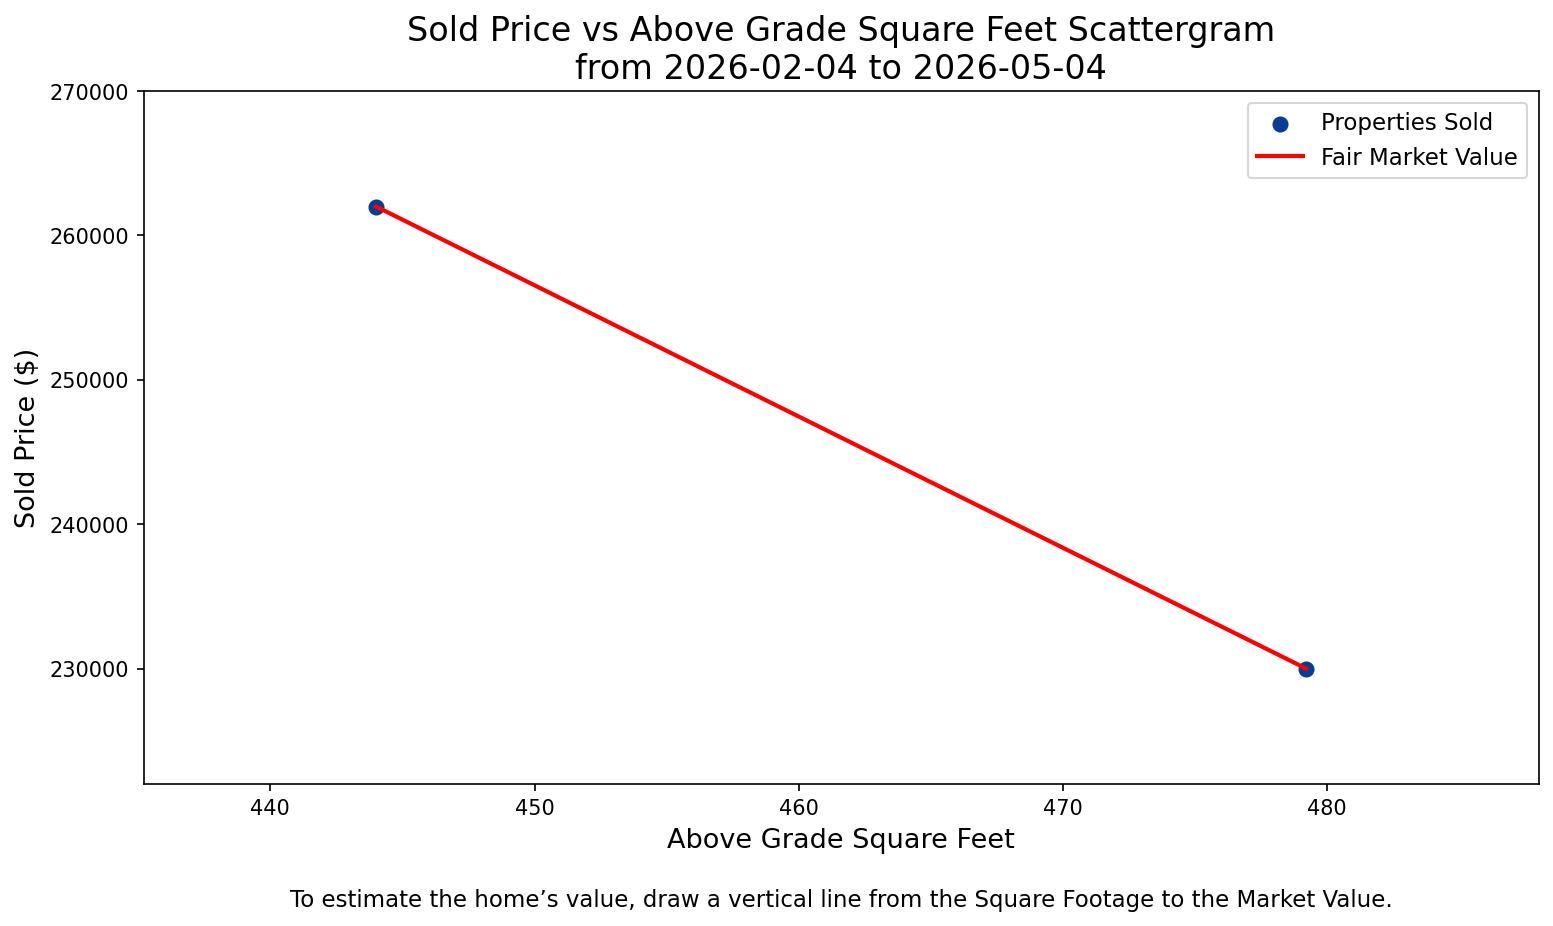
Price vs. Square Footage
The Price vs. Square Footage chart focuses on the most recent three-month period, from 2026-02-04 to 2026-05-04. It plots each sold unit by LivingArea and sold price, with a red trend line showing the recent fair market value relationship.
-
The recent trend line slopes downward: the smaller unit sold for more, while the larger unit sold for less. That means price was not being driven by size alone in this short sample.
-
The price-per-square-foot relationship likely varies meaningfully between units. Features such as condition, updates, exposure, location within the complex, and buyer perception may have influenced value more than square footage.
-
Because the three-month view contains only 2 sales, the fair market value line should be treated as directional rather than definitive. One additional sale could materially change the slope.
Key Takeaways
-
Supply is the main story: With no active listings at the time of this report, Storybook Village is showing a supply vacuum. That can support sellers, but the low monthly selling rate shows that buyer flow is still intermittent.
-
Pricing needs to be precise: The average sale took about 30 days, which suggests buyers are willing to act when the value is clear. In a small, comparable complex, even modest overpricing can stand out quickly.
-
Features may matter more than size: The recent square footage chart does not show a simple “larger equals more expensive” pattern. For a specific unit, condition, layout, exposure, and recent comparable sales should carry more weight than square footage alone.
Considering a Move?
If you own in Storybook Village or are thinking about buying there, the numbers point to a small, low-supply market where individual listing details matter.
Buying: I can help you compare recent sales, assess whether a unit is priced fairly, and avoid relying too heavily on square footage alone.
Selling: I can help you position your unit against the most relevant recent sales and price it in a way that reflects both the current lack of inventory and the thin buyer pool.
Want a custom pricing read for a Storybook Village unit?
Let’s talk.