
Calgary's Apartment market remained buyer-favouring in September 2026, with sales still below last year's pace and the benchmark price continuing to decline. The month also showed a sharp split by price range: sales strengthened below $250,000 while activity weakened across higher bands. This report examines the 13-month trajectory, current price-range listing supply, district differences and the practical implications of those patterns.
Executive Summary
Calgary's Apartment market remained in a Buyer's Market position in September 2026, with official CREB Months of Supply at 5.29. Sales totalled 343, down 14.25% from September 2025, while new listings fell 22.65% to 717 and inventory declined 9.38% to 1,816. The benchmark price was $291,400, down 8.28% year over year. Although sales improved modestly from August, the city-wide balance remained buyer-favouring.
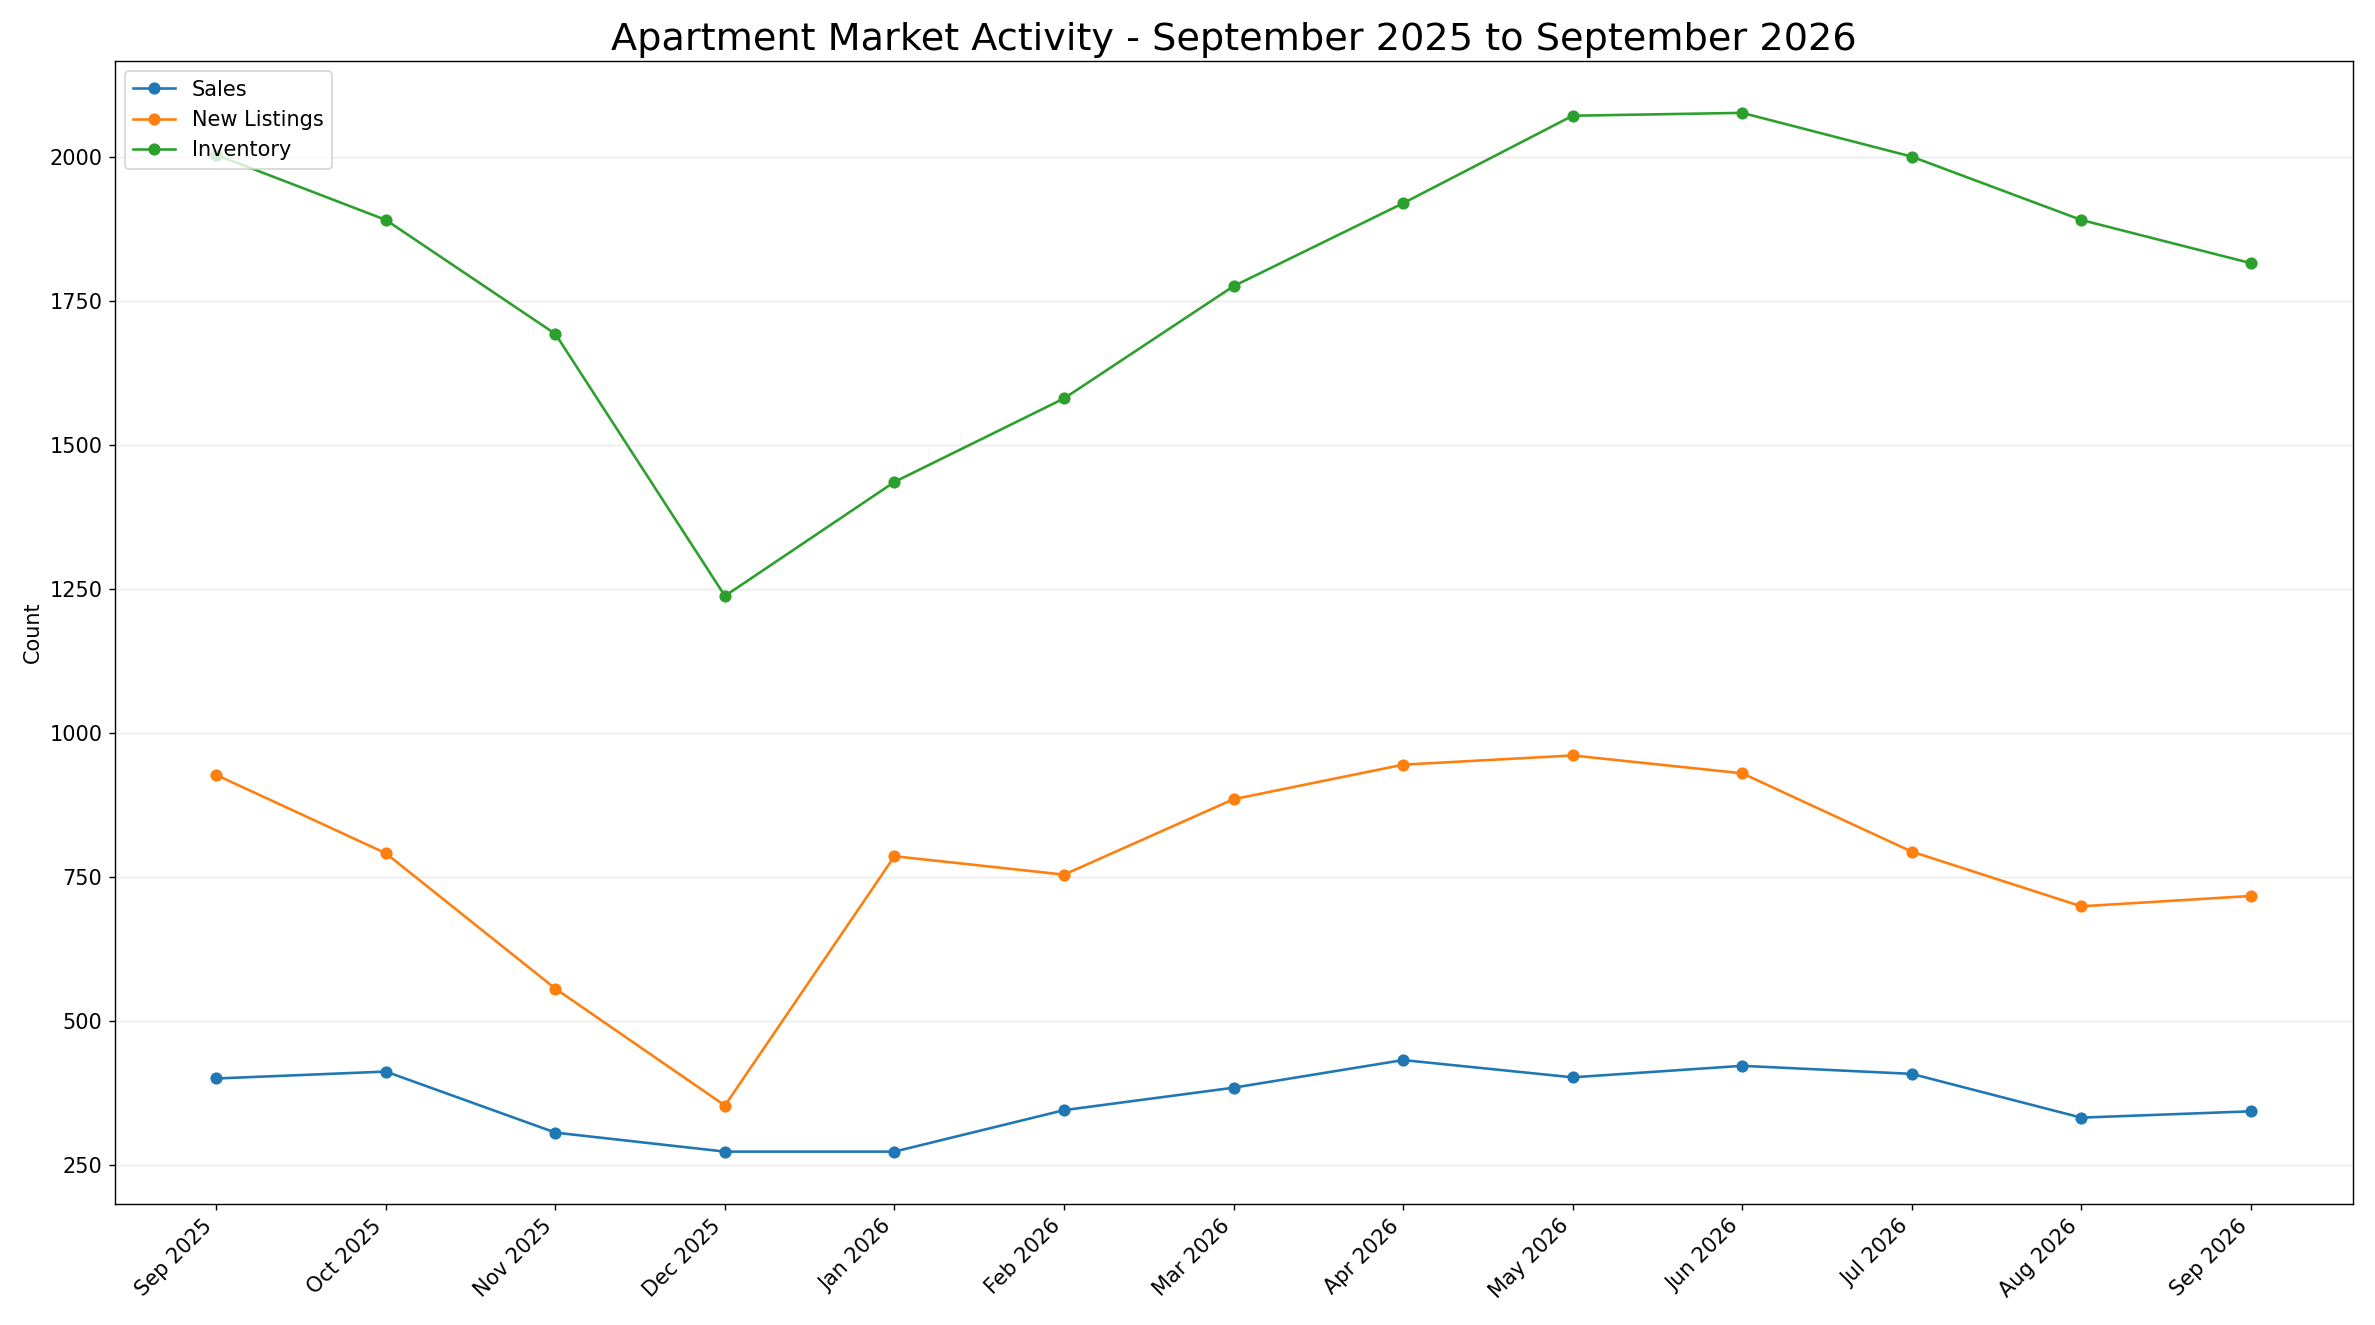
The 13-month trajectory shows a late-2025 contraction followed by a broad rebuilding of activity and inventory through the first half of 2026. Inventory peaked just above 2,000 units in May and June before declining through September, while sales softened sharply in August and recovered only slightly in September. Supply therefore eased from its early-summer high without restoring sales to the prior-year pace.
Price-range conditions were distinctly split. Sales increased 24.2% below $200,000 and 54.2% from $200,000-$249,999, but declined in every range above $250,000. Current Active Listings were most concentrated from $250,000-$299,999 and at $400,000+. Geography was also uneven: district Months of Supply ranged from 3.89 in West to 15.38 in North East, and every district benchmark price was lower year over year. For buyers and sellers, the city-wide classification is useful context, but the relevant competitive environment depends heavily on price range, district and the immediate comparable set.
Apartment Market at a Glance
Source: CREB® City of Calgary Monthly Statistics, September 2026. Market Status is derived only from official Apartment Months of Supply.
How the Apartment Market Is Changing
The 13-month CREB series shows an Apartment market that contracted late in 2025, rebuilt activity and inventory through the first half of 2026, and then cooled again through late summer. In September 2025, Calgary recorded 400 Apartment sales, 927 new listings and 2,004 units of inventory. By December, sales had fallen to 273, new listings to 353 and inventory to 1,238, leaving the market at a much lower year-end level across all three measures.
Activity rebuilt quickly after January. Sales rose from 273 in January to 432 in April, while new listings reached 961 in May. Inventory increased more steadily, moving from 1,436 in January to 2,072 in May and 2,077 in June. Through July, sales remained above 400 and inventory stayed close to 2,000, but August marked a sharper slowdown: sales fell to 332, new listings to 699 and inventory to 1,891.
September brought a modest month-to-month improvement in activity without reversing the broader annual softness. Sales increased to 343 and new listings to 717, while inventory declined further to 1,816. Compared with September 2025, however, sales were still 14.25% lower, new listings were down 22.65% and inventory was 9.38% lower. Official Months of Supply increased from 5.01 a year earlier to 5.29, leaving the city-wide Apartment segment in a Buyer's Market.
Price movement remained consistent with that softer competitive backdrop. The benchmark price declined from $317,700 in September 2025 to $291,400 in September 2026, an 8.28% year-over-year decrease. The 13-month series shows the benchmark generally moving lower, including $303,600 in December, $301,400 in April and $295,400 in August. September therefore closed the period with slightly better sales than August, but with activity, supply and benchmark price still materially below their year-earlier levels.
The sequence from May through September is also important. Inventory moved from 2,072 in May to 2,077 in June before declining in each of the next three months, while sales moved from 402 in May to 422 in June, 408 in July, 332 in August and 343 in September. That combination shows supply easing from its early-summer peak, but without a comparable recovery in transaction volume by the end of the period.
Where the Apartment Market Is Diverging
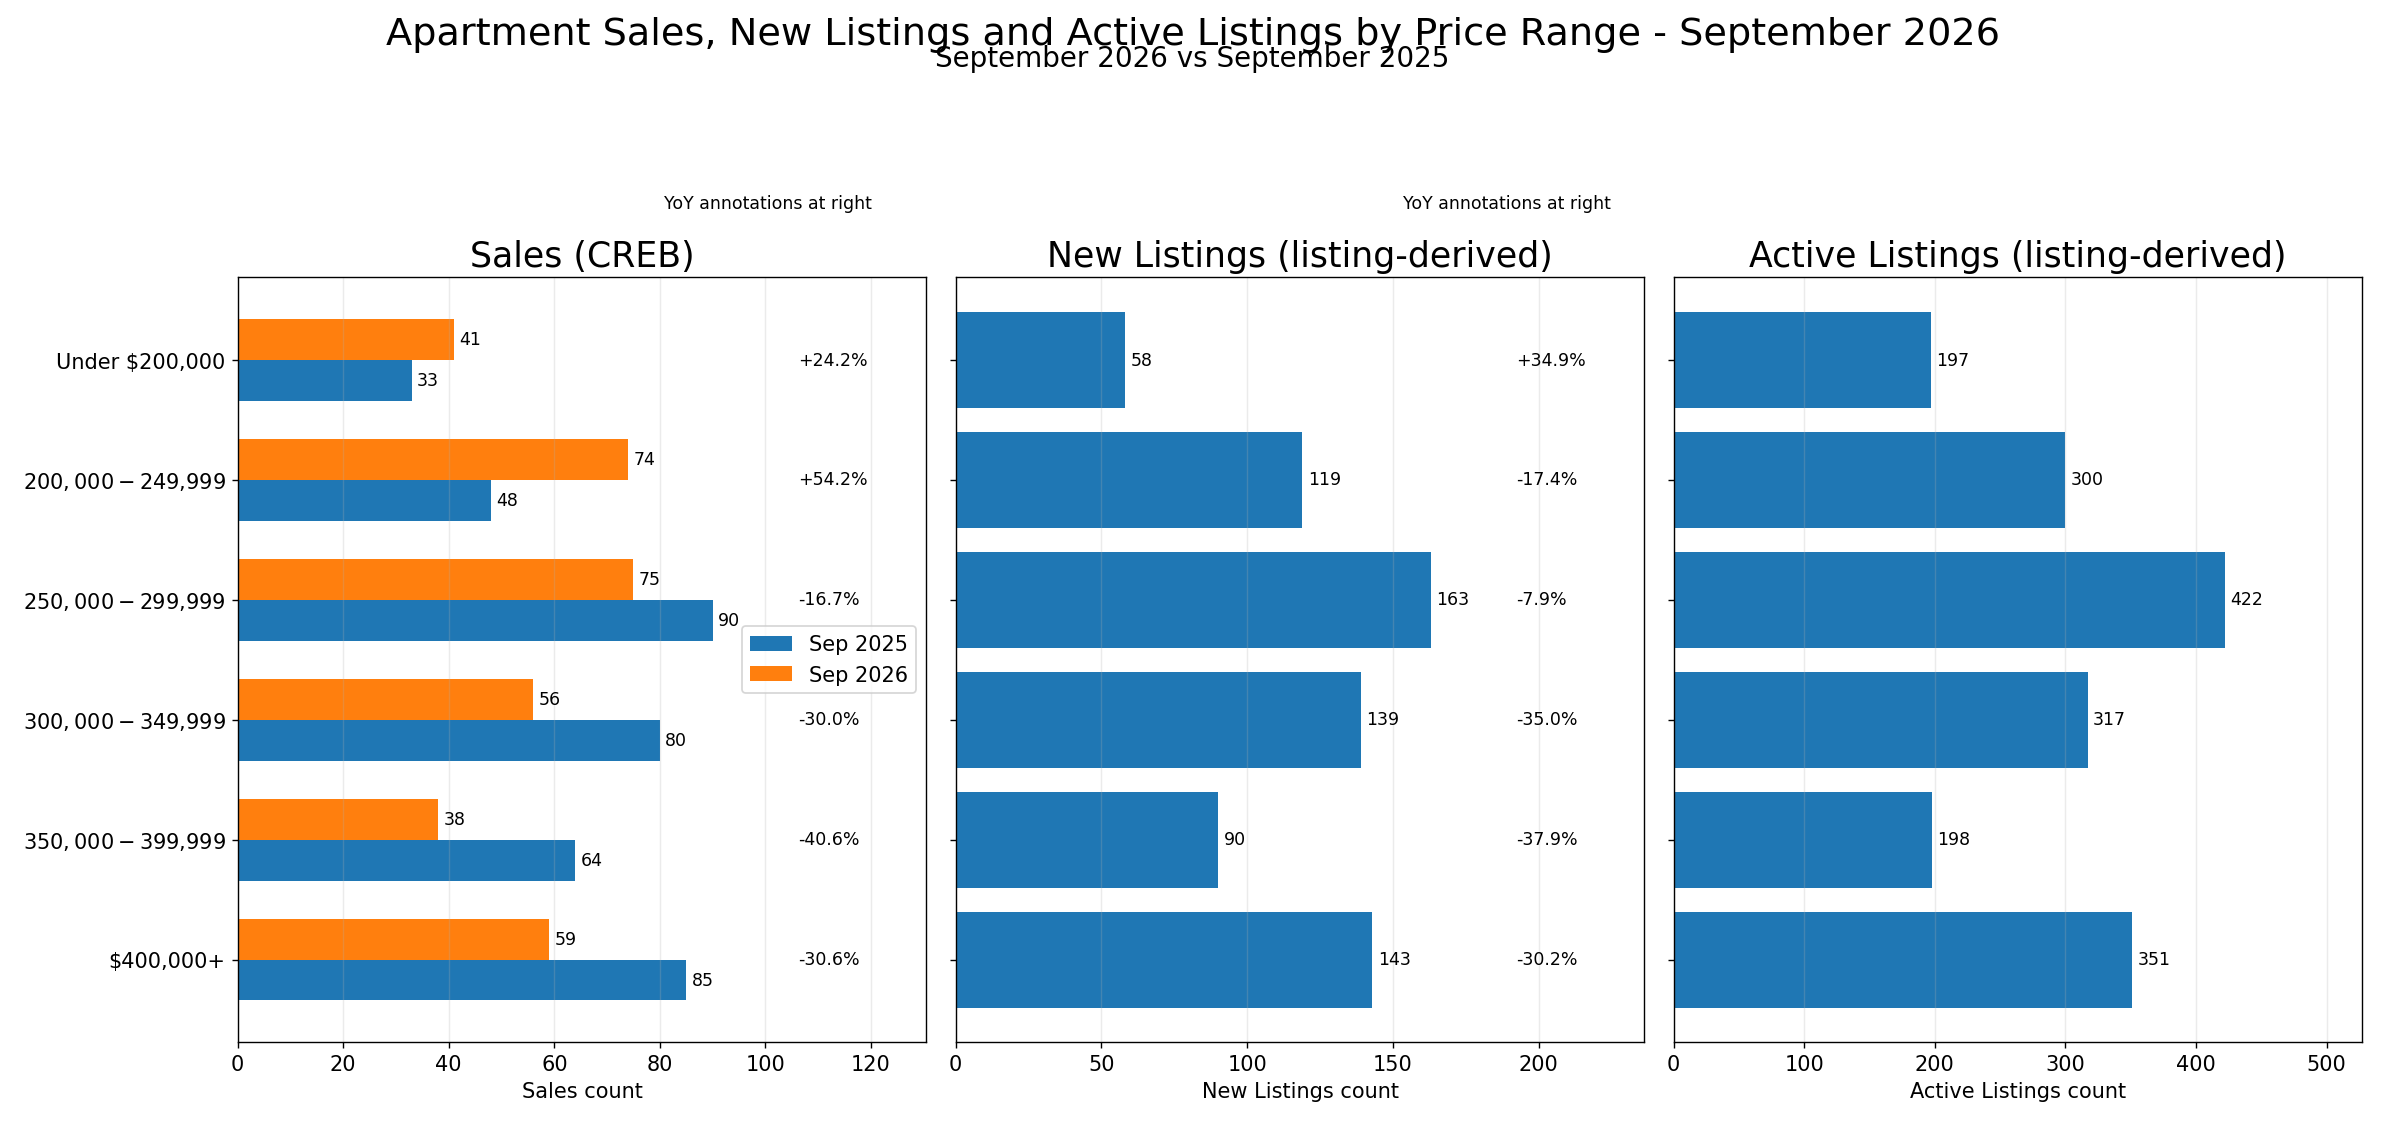
September's price-range evidence shows that Apartment demand was strongest at the lower end of the market and progressively weaker across most higher bands. Official CREB sales under $200,000 increased from 33 in September 2025 to 41 in September 2026, a 24.2% gain. Sales from $200,000-$249,999 rose even more sharply, from 48 to 74, or 54.2%. These were the only two governed ranges with year-over-year sales growth.
The listing-derived supply evidence adds an important distinction between those lower bands. Under $200,000, new listings increased 34.9% to 58 and there were 197 current Active listings, so stronger sales occurred alongside a larger inflow of listings. From $200,000-$249,999, new listings fell 17.4% to 119 while 300 listings remained Active. The sales improvement in that band therefore coincided with less new listing flow than a year earlier, not with an expanding supply pipeline.
Above $250,000, the pattern reversed. Sales from $250,000-$299,999 declined 16.7% to 75, while new listings fell 7.9% and the range contained the largest current Active count at 422. Sales from $300,000-$349,999 were down 30.0% to 56 as new listings fell 35.0%, with 317 Active listings. The $350,000-$399,999 range recorded the largest sales decline, down 40.6% to 38, alongside a 37.9% reduction in new listings and 198 Active listings.
At $400,000 and above, sales fell 30.6% to 59 and new listings declined 30.2% to 143, while 351 listings remained Active. Taken together, September shows meaningful strength below $250,000, softer conditions from $250,000 upward, and substantial current choice concentrated in the $250,000-$349,999 and $400,000+ ranges. The city-wide Apartment result therefore masks materially different activity and supply patterns by price point.
The listing-flow pattern also matters for interpreting those sales changes. New listings declined year over year in every band above $200,000, with the steepest reductions from $300,000 upward. That contraction reduced the amount of fresh supply entering those segments, but it did not eliminate the sizeable stock of current Active listings already available, especially in the $250,000-$299,999, $300,000-$349,999 and $400,000+ bands.
| Price Range | Sales | Sales YoY | New Listings | New Listings YoY | Active Listings |
|---|---|---|---|---|---|
| Under $200,000 | 41 | +24.2% | 58 | +34.9% | 197 |
| $200,000-$249,999 | 74 | +54.2% | 119 | -17.4% | 300 |
| $250,000-$299,999 | 75 | -16.7% | 163 | -7.9% | 422 |
| $300,000-$349,999 | 56 | -30.0% | 139 | -35.0% | 317 |
| $350,000-$399,999 | 38 | -40.6% | 90 | -37.9% | 198 |
| $400,000+ | 59 | -30.6% | 143 | -30.2% | 351 |
Sales and Sales YoY are official CREB® Apartment measures. New Listings, New Listings YoY and Active Listings are derived from supplied Pillar 9™ MLS® records. Active Listings is an Active-only listing count and is not CREB Inventory.
Geographic Differences
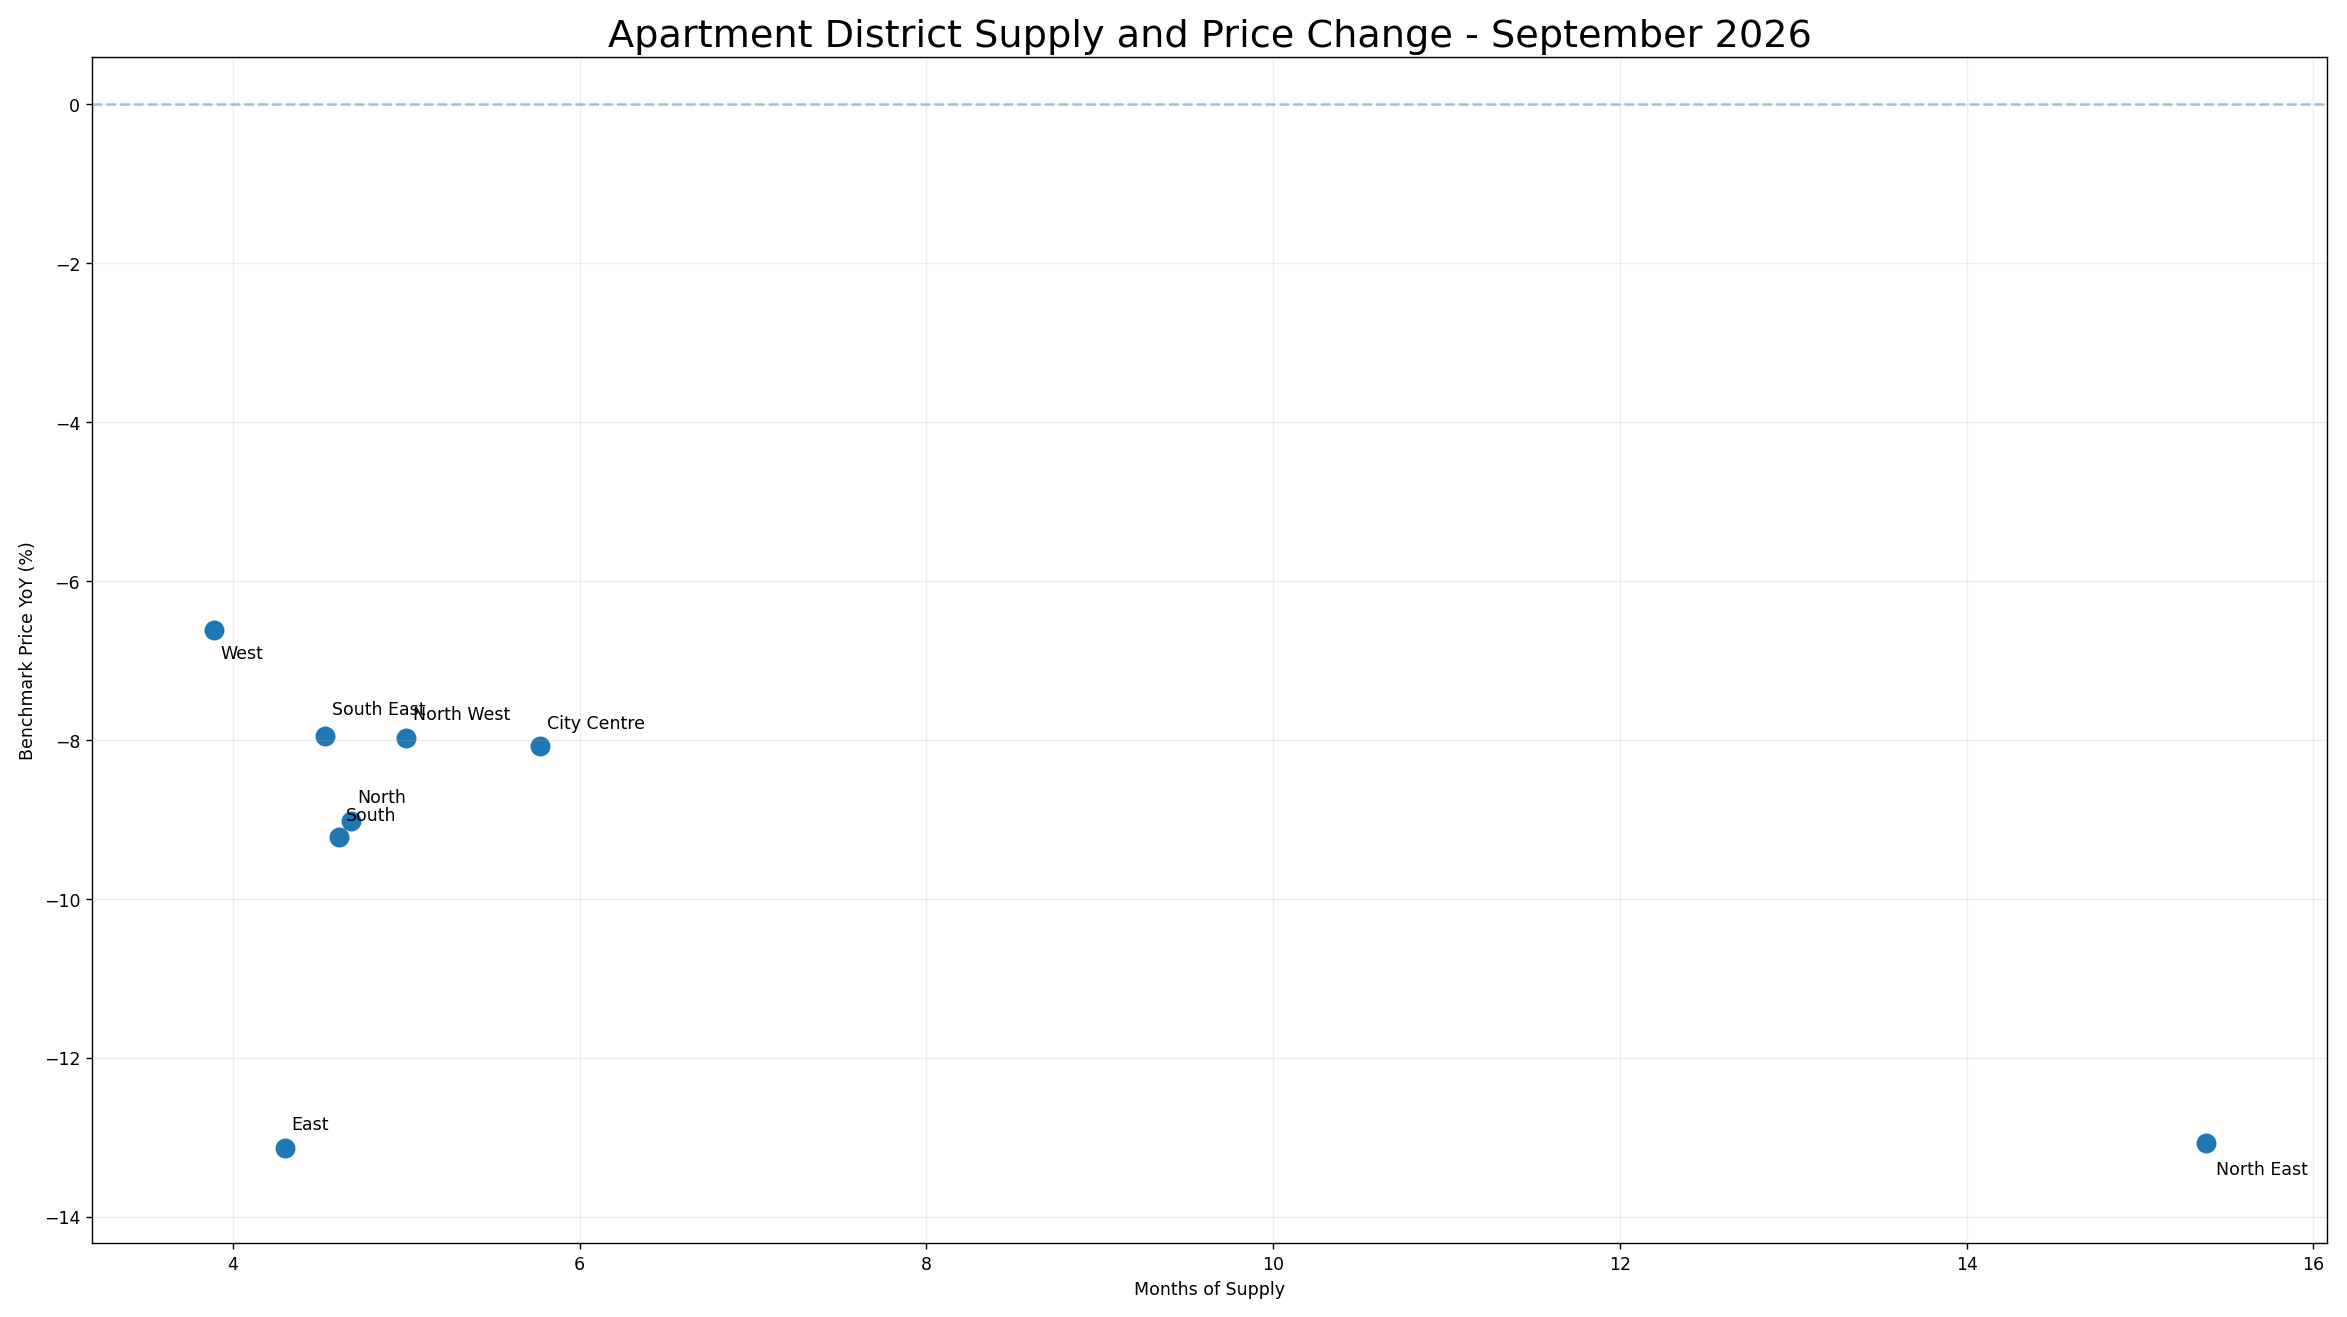
Apartment conditions varied sharply across Calgary's eight CREB districts in September. West had the lowest Months of Supply at 3.89, followed by East at 4.30, South East at 4.53, South at 4.61 and North at 4.68. North West was at 5.00 and City Centre at 5.77. North East was a clear outlier at 15.38 Months of Supply, reflecting a much slower sales pace relative to its published inventory.
Benchmark prices were lower year over year in every district. West recorded the smallest decline at 6.62%, followed by South East at 7.95%, North West at 7.97% and City Centre at 8.08%. North was down 9.02% and South 9.22%. The largest annual decreases were in North East at 13.07% and East at 13.13%.
The district evidence shows that elevated supply and annual price weakness were widespread, but their relationship was not uniform. North East combined the highest Months of Supply with one of the largest benchmark declines, while East had a much lower supply reading but a slightly larger annual price decrease. District supply and price movement should therefore be read together as separate indicators of local conditions rather than as evidence that one measure directly caused the other.
| District | Sales | Inventory | Months of Supply | Benchmark Price | Benchmark Price YoY |
|---|---|---|---|---|---|
| City Centre | 142 | 819 | 5.77 | $297,900 | -8.08% |
| North East | 8 | 123 | 15.38 | $249,500 | -13.07% |
| North | 31 | 145 | 4.68 | $298,400 | -9.02% |
| North West | 30 | 150 | 5.00 | $274,900 | -7.97% |
| West | 38 | 148 | 3.89 | $321,700 | -6.62% |
| South | 44 | 203 | 4.61 | $271,900 | -9.22% |
| South East | 40 | 181 | 4.53 | $309,100 | -7.95% |
| East | 10 | 43 | 4.30 | $209,800 | -13.13% |
Source: CREB® City of Calgary Monthly Statistics, September 2026.
What Is Driving the Apartment Market
The central internal mechanism in September was the continuing imbalance between sales activity and the amount of available supply. Apartment sales were 14.25% below a year earlier, while inventory was down a smaller 9.38%. New listings fell more sharply, but the existing inventory base was still sufficient to keep official Months of Supply at 5.29, above the 5.01 recorded in September 2025 and firmly in buyer-favouring territory.
That city-wide balance was not produced evenly. The two lowest price ranges recorded higher sales than a year earlier, while every governed range above $250,000 had lower sales. At the same time, current Active listings were concentrated most heavily from $250,000-$299,999, from $300,000-$349,999 and at $400,000+. This means the same city-wide market can contain relatively stronger turnover at lower price points and more persistent choice at higher ones.
Geography adds another layer. District Months of Supply ranged from 3.89 in West to 15.38 in North East, while all eight districts recorded lower benchmark prices year over year. The September Apartment market is therefore best understood as a buyer-favouring city-wide environment shaped by uneven absorption across both price ranges and districts, rather than as one uniform level of competition throughout Calgary.
What This Means for Buyers and Sellers
For Apartment buyers, September's 5.29 Months of Supply indicates that available supply remained high relative to the current sales pace. That generally supports a broader comparison set, but the amount of choice and the intensity of turnover differ substantially by price range. Below $200,000 and from $200,000-$249,999, official sales were higher than a year earlier, so buyers in those lower bands are participating in segments with stronger transaction activity even though current Active listings remain available.
From $250,000 upward, the context is softer. The $250,000-$299,999 range had 422 current Active listings, the largest of the six governed bands, while sales were down 16.7% year over year. Sales were down 30.0% from $300,000-$349,999, 40.6% from $350,000-$399,999 and 30.6% at $400,000+. Those ranges still contained 317, 198 and 351 Active listings respectively. A larger competing set combined with weaker sales can make differences in price, condition, building attributes and location more visible when properties are compared.
For sellers, the city-wide Buyer's Market classification is useful context but should not replace segment-specific evidence. A property priced below $250,000 is participating in a different sales pattern from one priced above $300,000. District conditions also vary materially: West recorded 3.89 Months of Supply, while North East was at 15.38, and annual benchmark-price declines ranged from 6.62% to 13.13%.
For both buyers and sellers, the practical implication is to narrow the city-wide September evidence to the relevant price range, district and immediate comparable set. The report supports a market with meaningful buyer choice overall, but the competitive environment around an individual Apartment can differ substantially depending on where it sits within those layers.
What to Watch Next
First, watch whether sales continue to recover from the August low while inventory keeps declining. A sustained increase in sales alongside further inventory reduction would lower Months of Supply and make the current buyer-favouring balance less pronounced; renewed sales weakness would work in the opposite direction.
Second, monitor the split between the two sub-$250,000 ranges and the higher price bands. If sales above $250,000 begin to improve relative to current Active supply, the present divergence would narrow. If lower-priced sales remain stronger while higher ranges stay soft, price-range segmentation will remain central to interpretation.
Finally, track the extreme district spread in Months of Supply, especially North East relative to West and the mid-range districts. Meaningful convergence would make the city-wide reading more representative of local conditions; a persistent or wider spread would increase the importance of district-level context.
Explore the Market in More Detail
Sources and Methodology
Official CREB® City of Calgary Monthly Statistics are used for the Apartment benchmark price, sales, new listings, inventory, months of supply, the 13-month activity series, Apartment sales by price range, and the district measures shown in this report.
Pillar 9™ MLS® System records supplied for this report are used only for New Listings and New Listings YoY by price range, current Active Listings by price range, and diagnostic source reconciliation. Price-range New Listings are grouped by Original List Price. Active Listings use Current Price and include Active status only; Pending listings are excluded. These Active Listings counts are not the official CREB Inventory measure.
The overall Apartment Market Status is based on official city-wide Apartment Months of Supply: below 2.5 is a Seller's Market, 2.5 through 4.0 is a Balanced Market, and above 4.0 is a Buyer's Market. Price-range and district evidence is presented descriptively and is not assigned separate market classifications.