
The October 2026 Calgary Apartment market report examines current sales, listings, prices and supply using official CREB® statistics, then explores differences across six price ranges and eight city districts. The report combines official market measures with defined listing-level price-range evidence to show where activity and available choices differ, and what those contrasts mean for buyers and sellers.
Executive Summary
Calgary's Apartment market remained buyer-oriented in October 2026, although the underlying picture was more varied than the city-wide numbers alone indicate. Official CREB reported 320 sales, down 22.3% year over year, alongside 638 new listings and 1,691 inventory units. Months of supply increased to 5.28 from 4.59 a year earlier, placing the segment in the governed buyer's-market range. The benchmark price was $288,800, down 7.9% from October 2025.
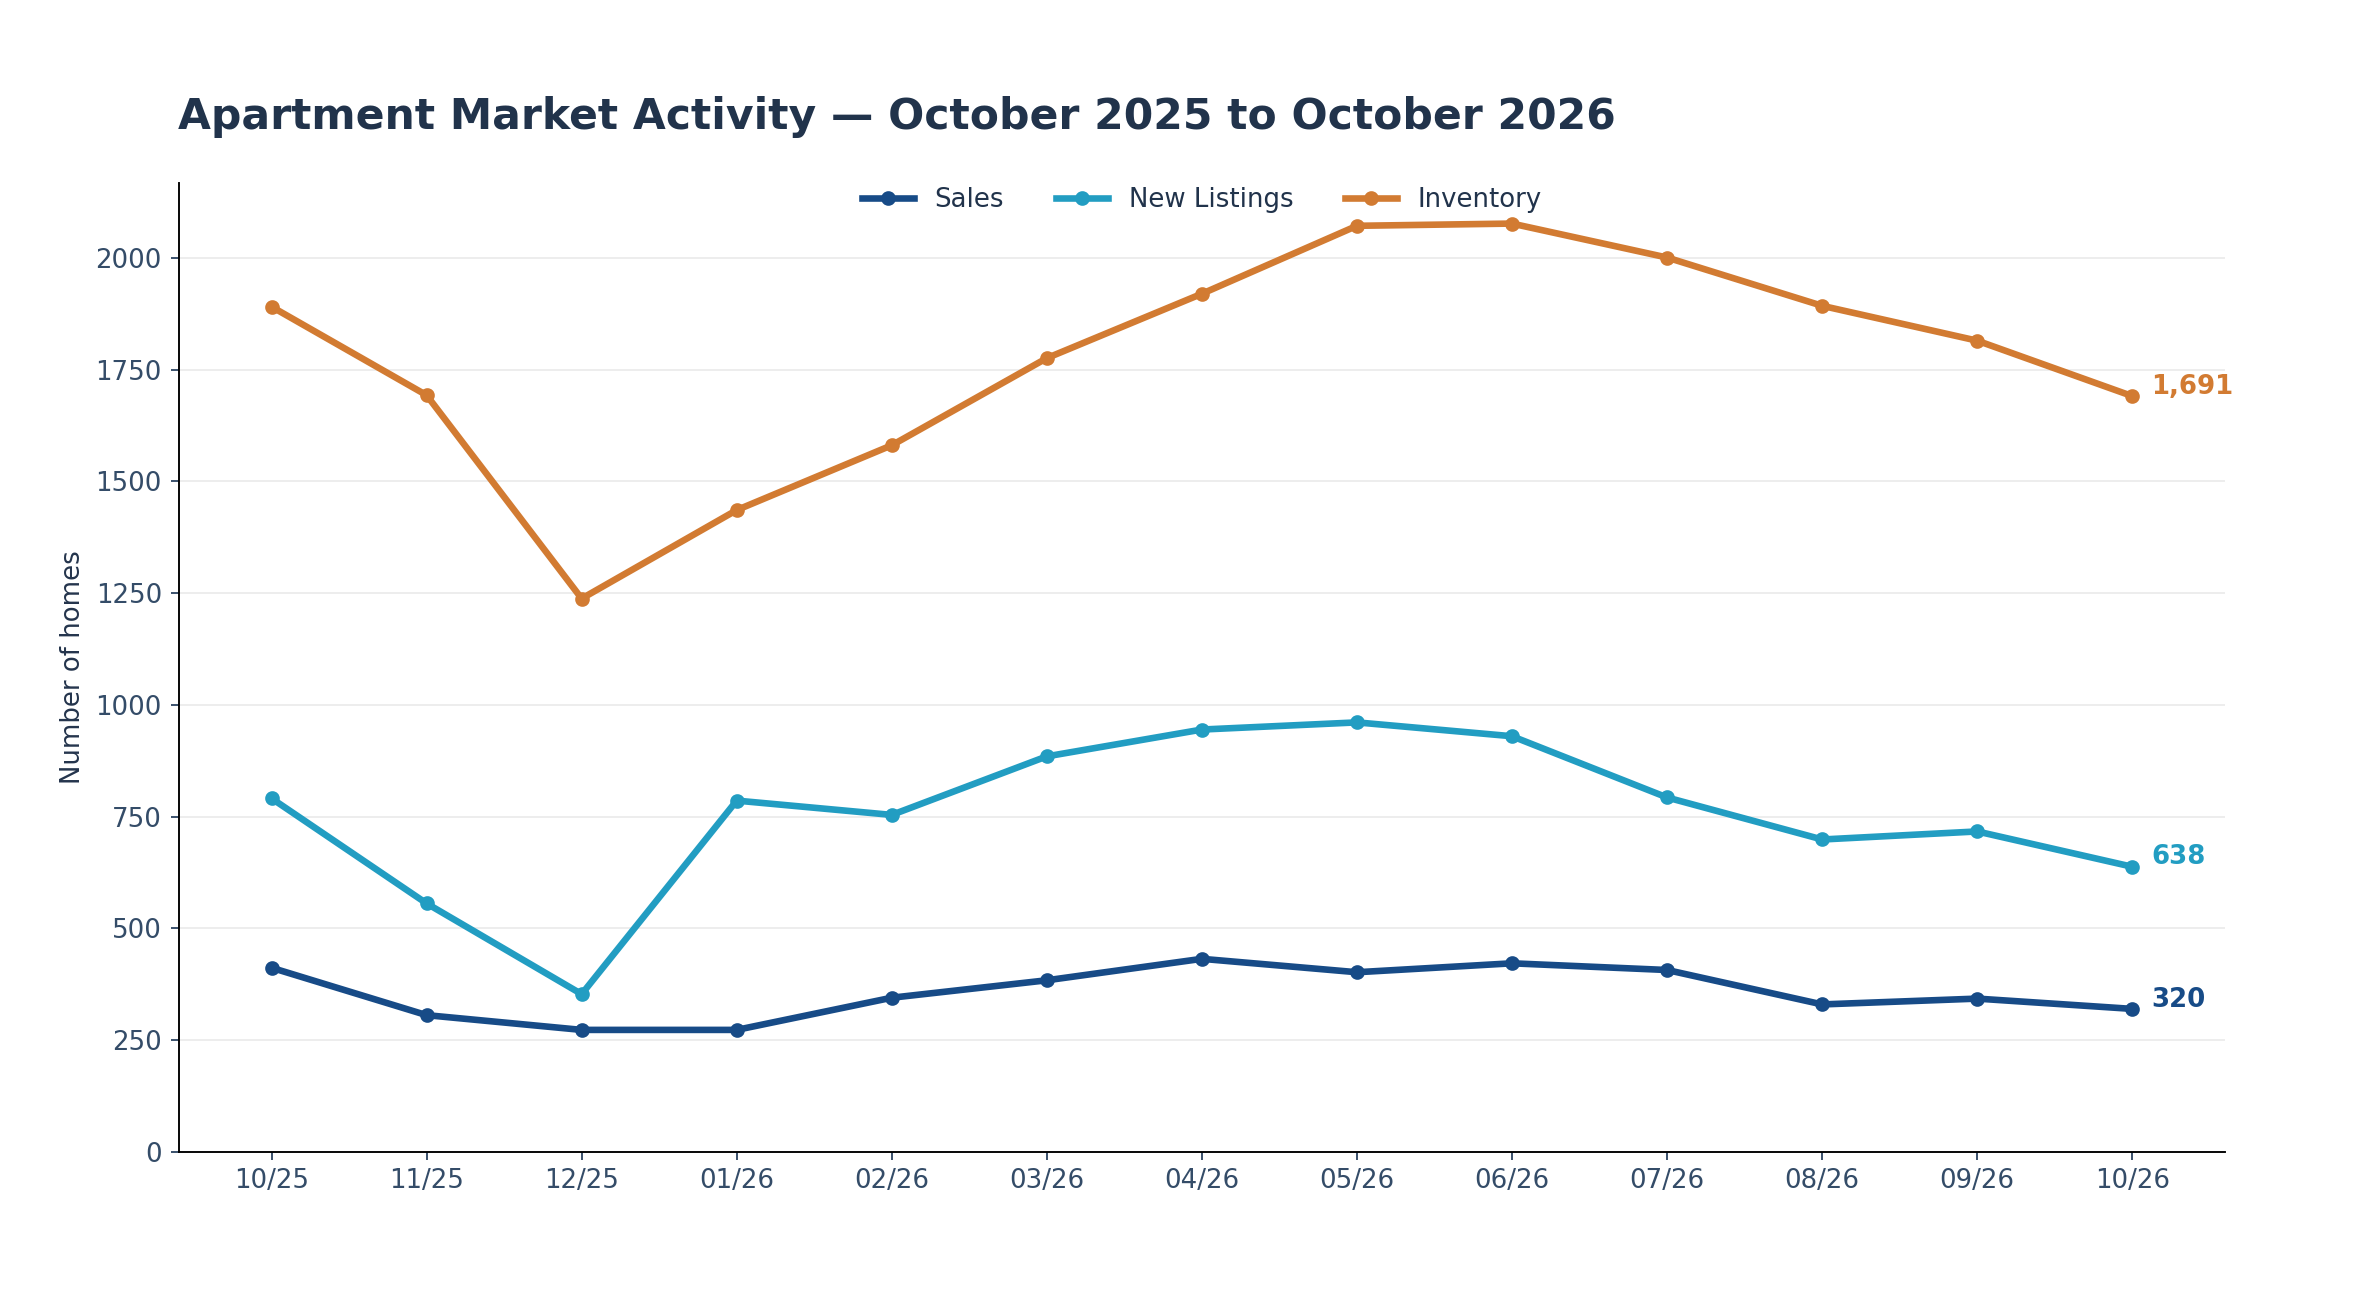
Over the most recent 13 months, inventory expanded into early summer 2026 and then eased, while sales lost momentum after a spring improvement. Lower inventory therefore did not produce a tighter October market: the transaction pace weakened by more than the year-over-year inventory count. That relationship is central to understanding current selection and pricing sensitivity.
The price-range results were uneven. Sales below $200,000 increased materially and sales between $200,000 and $249,999 held approximately steady, whereas every range above $250,000 registered fewer transactions than a year earlier. The greatest reductions occurred in the $250,000-$349,999 portion of the market. Listing-level Active counts showed substantial available choice in several middle and higher price bands, although they are not equivalent to official CREB Inventory.
Geography reinforced the differences. Apartment months of supply ranged from 3.88 in the South to 9.47 in the North, and every district showed an annual benchmark-price decline. For buyers and sellers, the practical conclusion is to use the city-wide direction as context, then evaluate recent comparable sales and current alternatives within the relevant price range and district. The next reports will show whether sales recover relative to supply and whether the current segment and geographic gaps narrow.
Apartment Market at a Glance
How the Apartment Market Is Changing
Calgary Apartment sales remained subdued in October 2026, with 320 transactions, down from 343 in September and 412 in October 2025. The year-over-year decline of 22.3% was steeper than the 19.3% reduction in new listings. As a result, fewer homes entered the market, but the smaller sales volume still left more months of supply relative to the pace of transactions than a year earlier. October's 5.28 months of supply compares with 4.59 in October 2025 and remains within the governed buyer's-market range for the apartment segment.
The 13-month record illustrates how that balance developed. Sales slowed from 412 in October 2025 to 273 in December, recovered through early 2026 and reached 432 in April. Activity subsequently eased, with 330 sales in August, 343 in September and 320 in October. This pattern is not simply a straight-line decline: spring activity improved from winter levels before weakening again later in the year. October closed below both the previous month and the same month a year ago.
New listings followed a different seasonal arc. After falling to 353 in December 2025, they rose through spring and peaked at 961 in May 2026. They then eased to 638 in October. Inventory responded with a delay, moving from 1,238 in December to 2,077 in June before retreating to 1,691 in October. The reduction from the June high shows that the number of homes on the market has contracted even as the sales environment remains relatively soft. October inventory was also 10.6% below its year-earlier level of 1,891.
The benchmark price provides an additional check on these activity patterns. The official Apartment benchmark decreased from $313,700 in October 2025 to $288,800 this October, a 7.9% annual decline. It also moved down from $291,400 in September. Lower inventory alone has therefore not translated into stronger recent benchmark pricing. The key relationship is between reduced supply and the weaker pace at which that supply is being absorbed. The market remains more favourable to selection and comparison than the lower inventory total might suggest on its own.
Where the Apartment Market Is Diverging
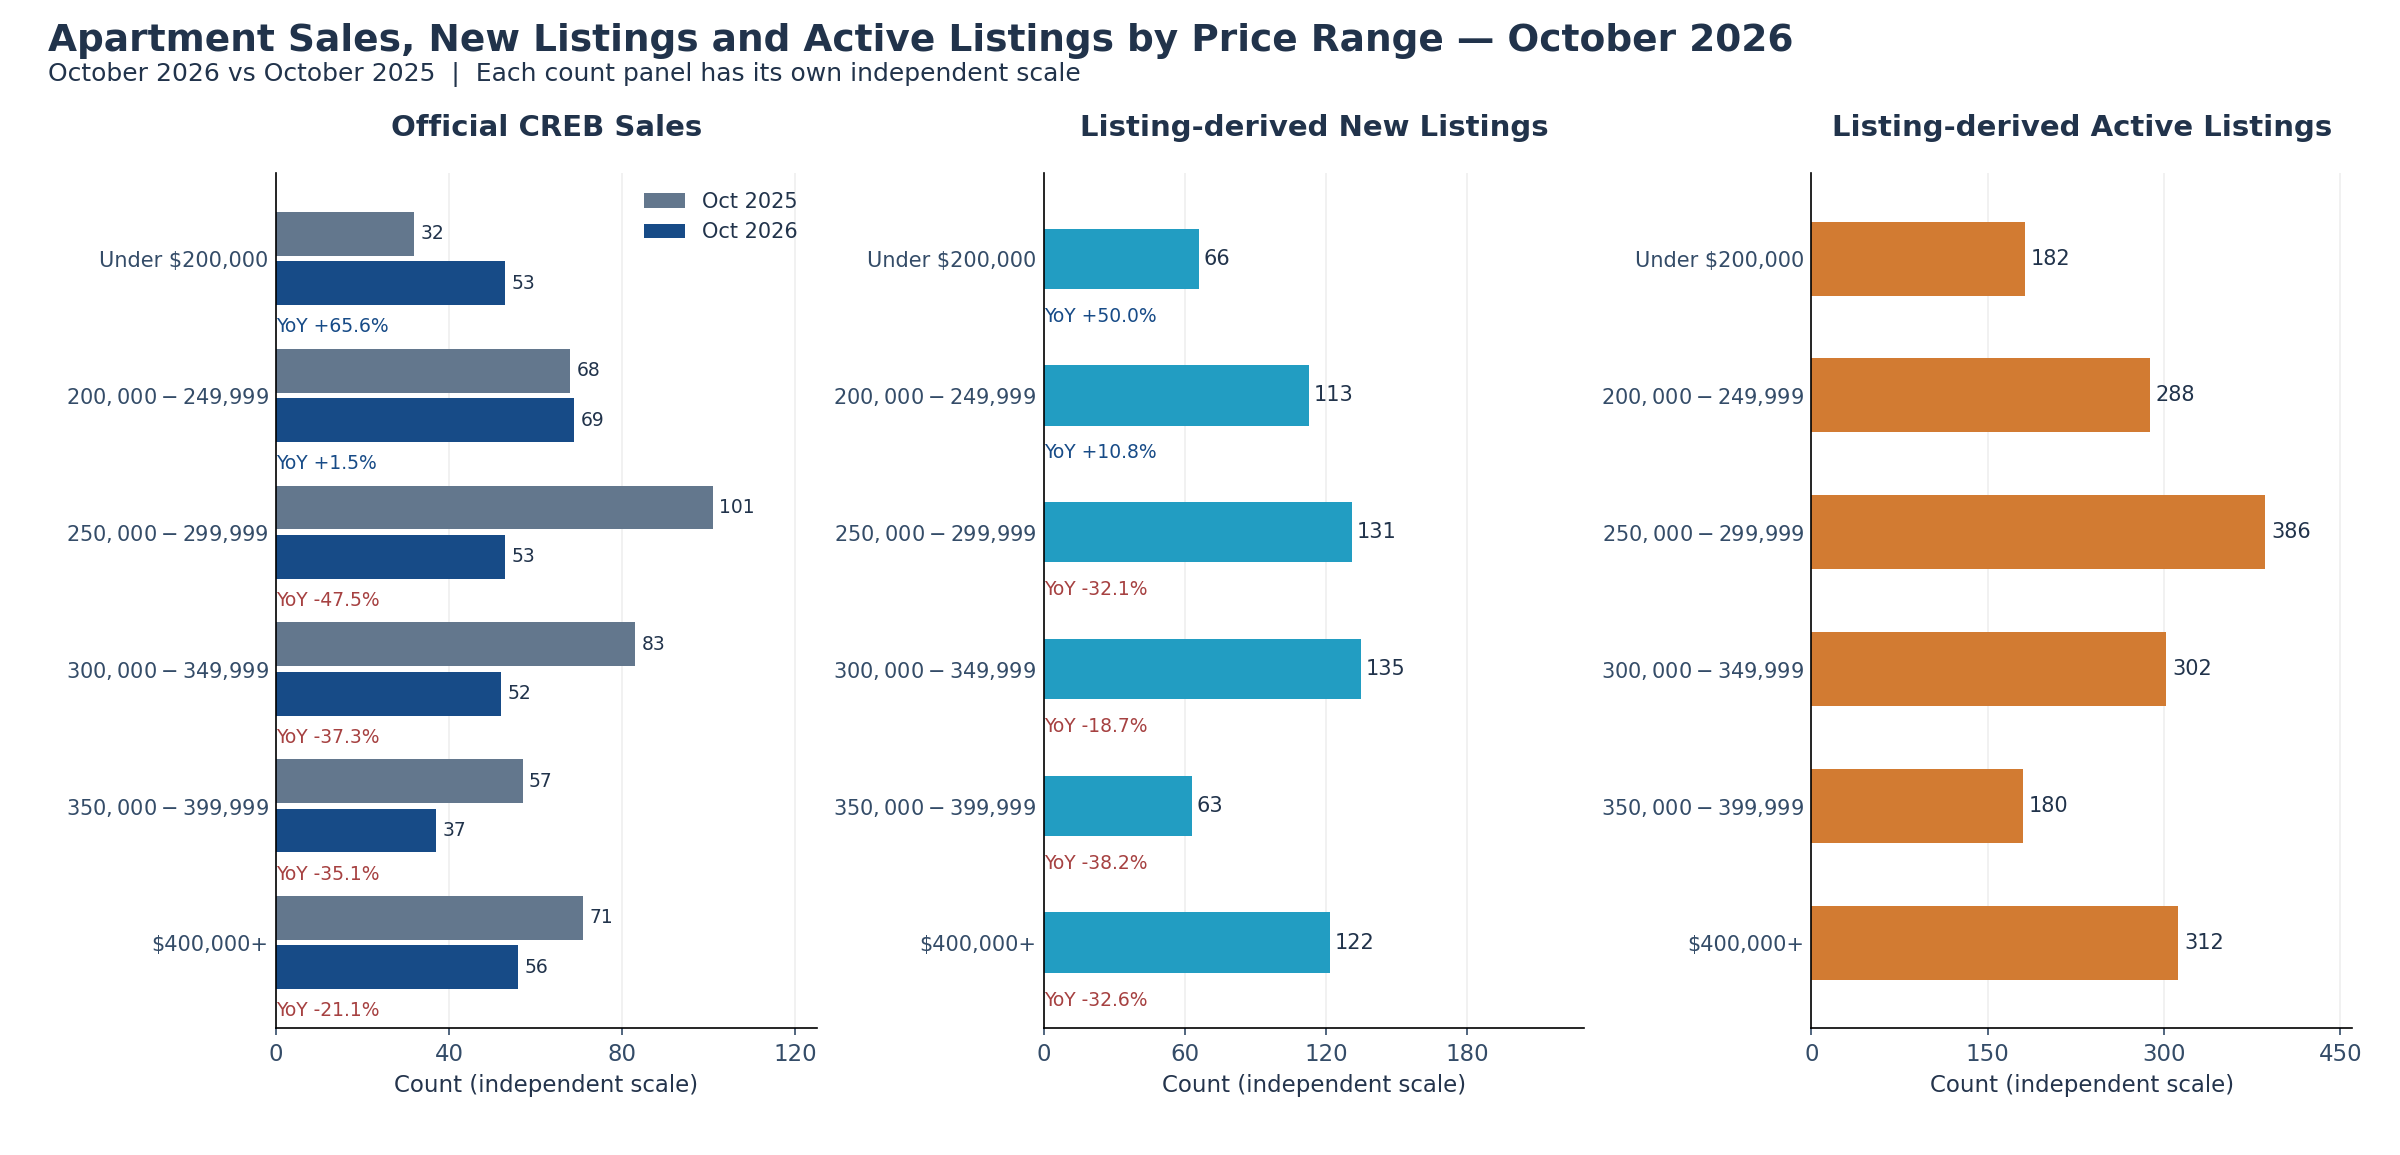
Apartment sales performance differed markedly across the six governed price ranges in October. Below $200,000, official CREB sales rose to 53 from 32 a year earlier, an increase of 65.6%. Sales between $200,000 and $249,999 were nearly unchanged at 69 versus 68. Together, these two lower-price bands stand apart from the declines across every higher range. The contrasting results show why the city-wide 22.3% sales reduction should not be treated as a uniform measure of demand for every apartment price point.
The most pronounced reductions were in the $250,000-$299,999 and $300,000-$349,999 ranges. Official sales fell to 53 from 101 in the former and to 52 from 83 in the latter, decreases of 47.5% and 37.3%, respectively. Sales in the $350,000-$399,999 range dropped from 57 to 37, while sales at $400,000 and above declined from 71 to 56. These are changes in completed transactions, not direct measures of buyer interest or individual property appeal. They indicate where market participation was more limited compared with October 2025.
New listings, measured from the supplied listing-level records using original asking prices, provide a separate view. Entries below $200,000 increased to 66 from 44 a year ago, while the $200,000-$249,999 band recorded 113 versus 102. Above $250,000, all four ranges recorded fewer new entries than a year earlier. The $250,000-$299,999 band had 131 new listings, down from 193; the $400,000+ band had 122, down from 181. These figures use the defined listing dataset and are not substitutes for CREB's city-wide new-listing total.
Active-only listing counts add the current availability dimension. The $250,000-$299,999 range had the most Active listings at 386, followed by $400,000+ at 312, $300,000-$349,999 at 302 and $200,000-$249,999 at 288. The $350,000-$399,999 band had 180, while 182 were priced below $200,000. Counts describe available advertised options, not quality-adjusted competition or a calculated months-of-supply measure for each band. The combination of weaker sales in much of the middle and upper market and substantial current choice makes precise price-range comparables especially important.
| Price Range | Sales | Sales YoY | New Listings | New Listings YoY | Active Listings |
|---|---|---|---|---|---|
| Under $200,000 | 53 | +65.6% | 66 | +50.0% | 182 |
| $200,000-$249,999 | 69 | +1.5% | 113 | +10.8% | 288 |
| $250,000-$299,999 | 53 | -47.5% | 131 | -32.1% | 386 |
| $300,000-$349,999 | 52 | -37.3% | 135 | -18.7% | 302 |
| $350,000-$399,999 | 37 | -35.1% | 63 | -38.2% | 180 |
| $400,000+ | 56 | -21.1% | 122 | -32.6% | 312 |
Sales and Sales YoY: official CREB® statistics. New Listings, New Listings YoY and Active Listings: supplied Pillar 9™ MLS® records. Active Listings counts are Active only and are not CREB Inventory.
Geographic Differences
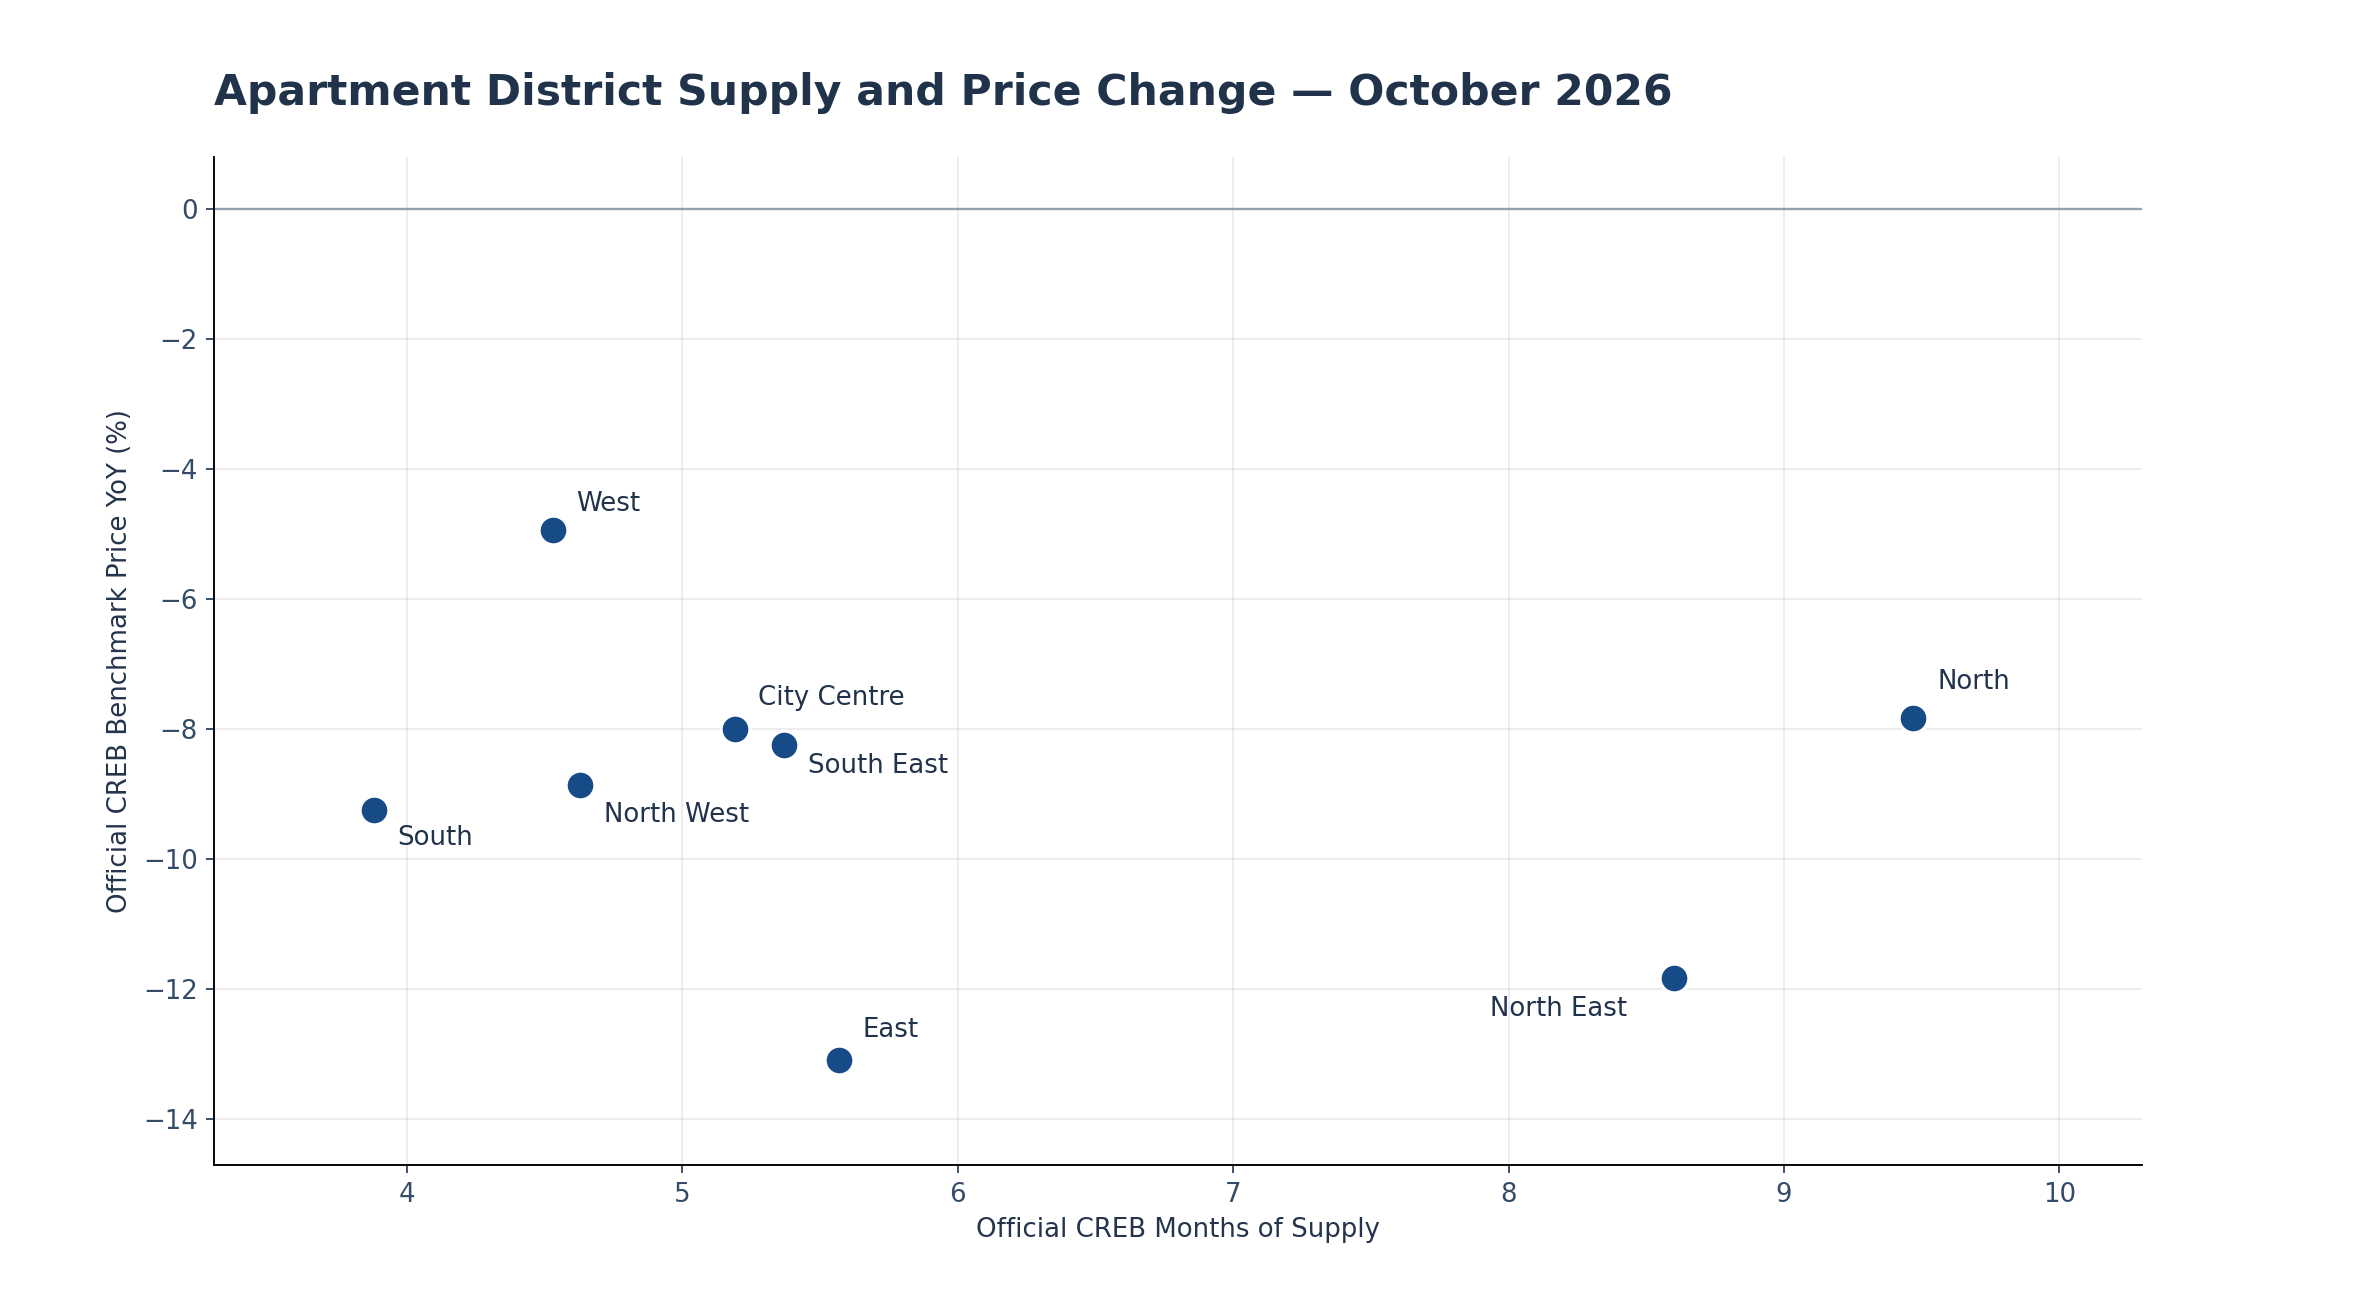
Apartment conditions also varied substantially by Calgary district in October. Official CREB months of supply ranged from 3.88 in the South to 9.47 in the North. The North East stood at 8.60, well above the City Centre's 5.19, while the East recorded 5.57. The North West, West and South East occupied a narrower middle range of 4.63, 4.53 and 5.37 months, respectively. These differences describe current supply relative to reported sales within each district; they do not create separate district market-status labels.
All eight districts recorded negative year-over-year apartment benchmark-price changes, although the magnitude differed. The East had the largest decline at 13.09%, followed by the North East at 11.82%. The West recorded a smaller 4.93% decline, while the North, City Centre and South East each had declines of about eight percent. Differences in benchmark levels were also notable: the West was $321,700, versus $205,200 in the East and $295,000 in the City Centre.
The City Centre accounted for 140 of the city's 320 October Apartment sales and 727 published district inventory units. The South recorded 48 sales, while both the North and North East recorded 15. Those activity and supply differences help explain why the city-level result cannot describe a single experience across Calgary. A district's months of supply and annual benchmark-price change should be read together as separate observations, not as proof that one directly caused the other.
| District | Sales | Inventory | Months of Supply | Benchmark Price | Benchmark Price YoY |
|---|---|---|---|---|---|
| City Centre | 140 | 727 | 5.19 | $295,000 | -7.99% |
| North East | 15 | 129 | 8.60 | $246,300 | -11.82% |
| North | 15 | 142 | 9.47 | $297,000 | -7.82% |
| North West | 30 | 139 | 4.63 | $273,900 | -8.85% |
| West | 30 | 136 | 4.53 | $321,700 | -4.93% |
| South | 48 | 186 | 3.88 | $267,200 | -9.24% |
| South East | 35 | 188 | 5.37 | $305,100 | -8.24% |
| East | 7 | 39 | 5.57 | $205,200 | -13.09% |
Source: CREB® City of Calgary Monthly Statistics, October 2026. District inventory sums to 1,686; the published Apartment citywide inventory is 1,691. Both source values are preserved as published.
What Is Driving the Apartment Market
The defining internal feature of the October Apartment market is that sales have contracted more sharply than the available supply measures might suggest. Official year-over-year sales fell 22.3%, compared with a 10.6% decline in inventory. That imbalance lifted months of supply to 5.28 despite fewer apartments appearing in the inventory count than a year earlier. The result is not a contradiction: the pace of completed transactions matters as much as the absolute number of properties on the market when assessing competitive conditions.
The 13-month trajectory reinforces this mechanism. New listings rose strongly through spring, inventory built into early summer, and both measures then eased. Sales did not regain enough momentum by October to return the market to the tighter balance seen a year before. The benchmark-price decline is consistent with a market in which lower inventory has not eliminated pricing pressure. It does not establish that any single listing or sale caused the price movement.
Price-range evidence adds another important qualification. Rising sales below $200,000 contrast with significantly fewer sales between $250,000 and $399,999. Current Active counts remain concentrated in several middle and higher bands, but they measure listing availability rather than an official price-range inventory series. Geographic evidence introduces a second layer: the North and North East have considerably more months of supply than the South, and annual benchmark-price declines vary across all eight districts. These overlapping differences explain why city-wide averages are useful starting points but insufficient for judging a specific apartment. The relevant market mechanism is the interaction of transactions, fresh entries and available selection at the comparable price and location level.
What This Means for Buyers and Sellers
For Apartment buyers, October's official 5.28 months of supply and lower benchmark price indicate a market with more opportunity to compare alternatives than would typically exist under tight supply conditions. That does not make every property interchangeable. The current Active count in a chosen price range, recent sales of genuinely comparable units, building characteristics and location remain important in assessing available choice. The particularly sharp annual sales declines from $250,000 through $399,999 suggest that asking prices in those bands warrant careful comparison with completed transactions rather than with competing listings alone.
The lower end of the market requires a different reading. Official sales below $200,000 increased substantially from a year ago, and sales from $200,000 to $249,999 were stable. Those numbers do not prove that individual lower-priced apartments will sell quickly, but they caution against applying the overall sales decline equally to every budget. Buyers comparing these units may encounter a different mix of recent transaction evidence and current advertised options than buyers in higher bands.
For sellers, the wider supply-to-sales relationship makes market positioning central. A listing can face substantial competing Active inventory even when the city-wide inventory total is declining. The number of current listings in a price range is useful context, while individual comparable sales remain a better basis for examining what buyers have actually paid. Days on market, condition, condo fees, layout and location may also differentiate properties, although the monthly aggregated evidence does not quantify their individual effects.
District differences add a second filter for both sides of a transaction. October months of supply ranged widely, and all districts showed annual benchmark-price declines of differing sizes. A North or North East apartment should not automatically be evaluated using the same local supply context as one in the South. Equally, the price-range figures apply city-wide and should not be interpreted as district-specific results. The most defensible reading pairs the official market direction with recent, genuinely comparable unit-level evidence, without assuming a guaranteed sale outcome or predicting a near-term price path.
What to Watch Next
The first relationship to monitor is whether Apartment sales stabilize relative to new listings. A sustained improvement in transactions without a matching rise in fresh supply would reduce months of supply; continued weak sales could preserve the current buyer-oriented balance even if inventory declines further. Comparing the monthly figures with the same period a year earlier will help distinguish seasonal movement from a more persistent shift.
The second test is whether price-range differences narrow. Watch whether the strong annual sales performance below $200,000 persists and whether the sharp declines between $250,000 and $399,999 begin to moderate. Compare those sales changes with new-listing volumes and current Active counts in the same governed bands; a change in only one measure would provide an incomplete picture.
Finally, monitor the gap between districts with relatively high and low months of supply alongside their separate annual benchmark-price movements. A narrowing supply gap would signal a more consistent geography of choice, while persistent variation would strengthen the case for location-specific comparisons. Future data, rather than a forecast, will determine whether October's pattern changes.
Explore the Market in More Detail
Sources and Methodology
City-wide Apartment benchmark price, sales, new listings, inventory, months of supply, the 13-month market series, official sales by price range and district results are from CREB® City of Calgary Monthly Statistics, October 2026. Market Status is classified from official city-wide Apartment months of supply.
Price-range New Listings, their year-over-year changes and current Active Listings are calculated from supplied Pillar 9™ MLS® System listing records. New Listings are grouped by original list price; current Active Listings are grouped by current price. Active Listings excludes Pending and is not equivalent to CREB Inventory. Source records are filtered to the Apartment property subtype. All district measures and official sales counts are retained from CREB.
Market patterns describe aggregated transactions and availability. Individual property comparisons depend on the characteristics and location of the apartment. Official district inventory figures have a small reported difference from the official city total; both are reproduced without adjustment.