
Calgary’s Row market moved into a buyer’s market in September 2026 as months of supply rose to 4.45. Sales were lower than a year earlier, inventory was slightly higher, and the benchmark price declined year over year. Conditions were not uniform: sales strengthened in the $300,000-$399,999 range while several other price bands weakened, and district supply levels varied widely across the city.
Executive Summary
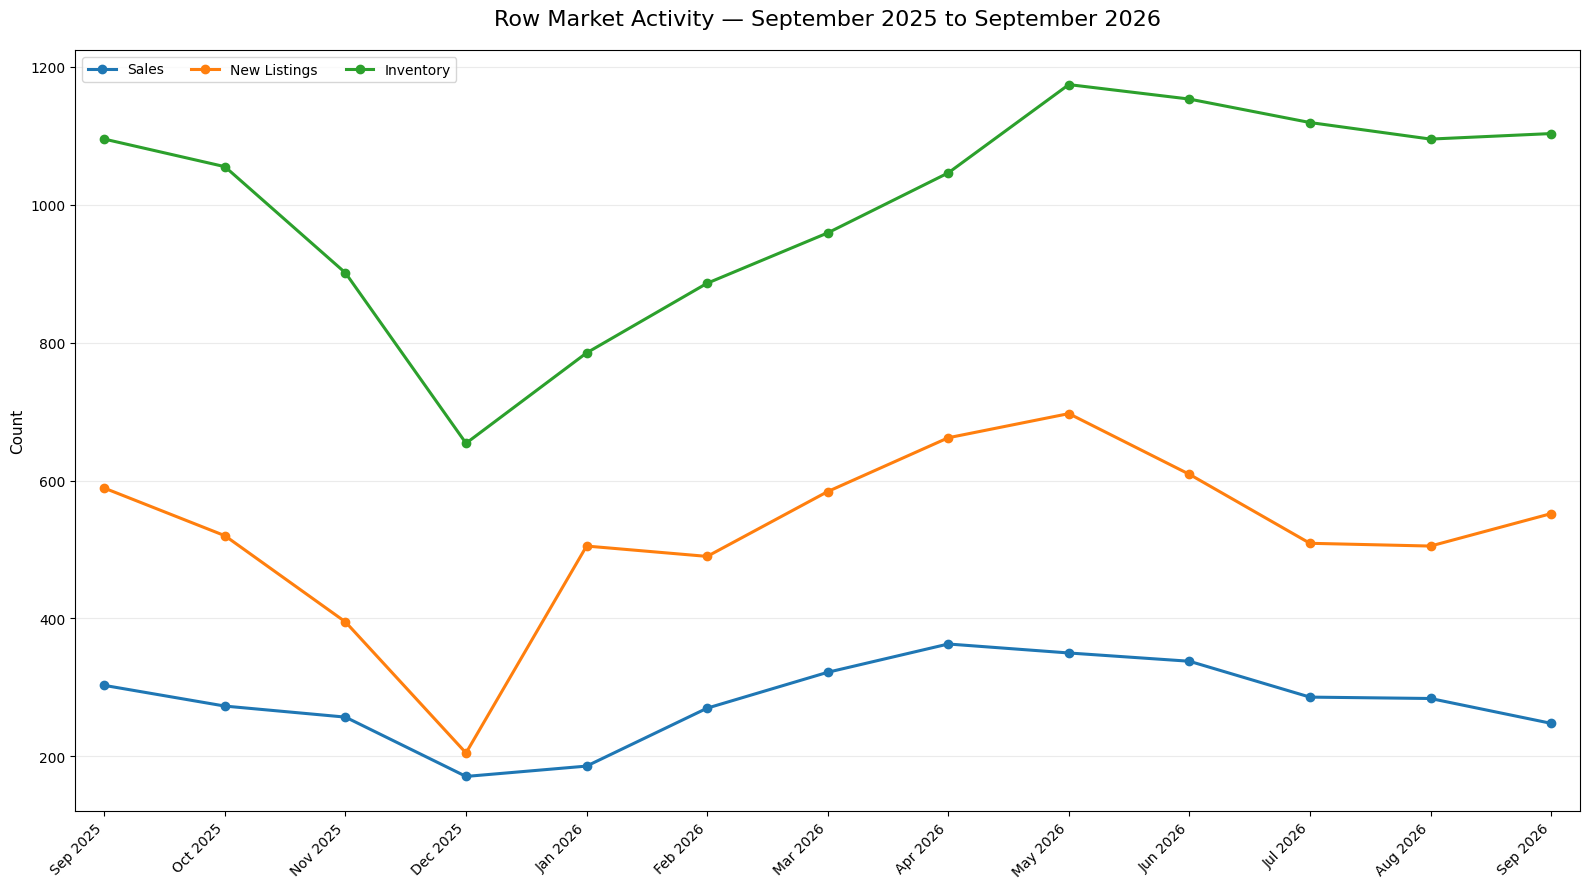
Calgary’s Row market was softer in September 2026, with the overall balance moving into a buyer’s market at 4.45 months of supply. Official CREB sales fell to 248, down 18.2% from a year earlier, while new listings declined by a smaller 6.3% and inventory edged 0.7% higher. The benchmark price was $412,400, 5.5% below September 2025. Over the 13-month trajectory, spring activity strengthened before easing through the summer, while inventory rebuilt from winter lows and remained above 1,100 by September.
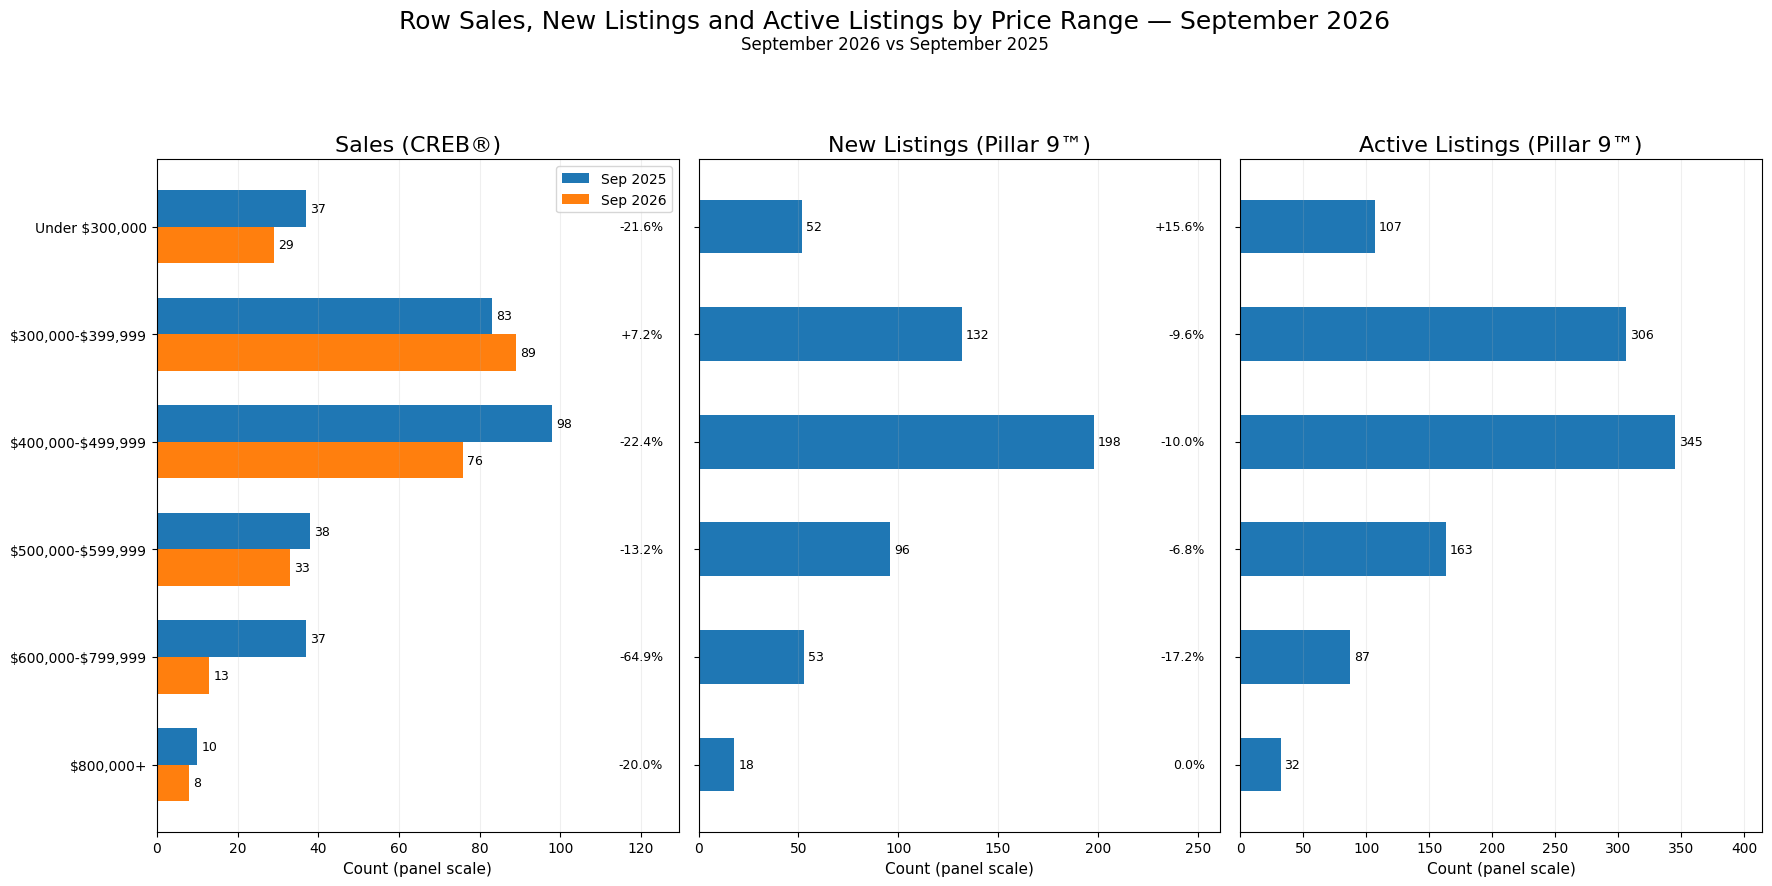
The softening was uneven by price range. Sales increased 7.2% in the $300,000-$399,999 range, but declined everywhere else, including a 64.9% drop from $600,000 to $799,999. Active-only listing counts were largest from $300,000 to $499,999, indicating substantial current choice in the same bands where most Row transactions occurred. That combination makes the city-wide slowdown more nuanced than a uniform decline across all price levels.
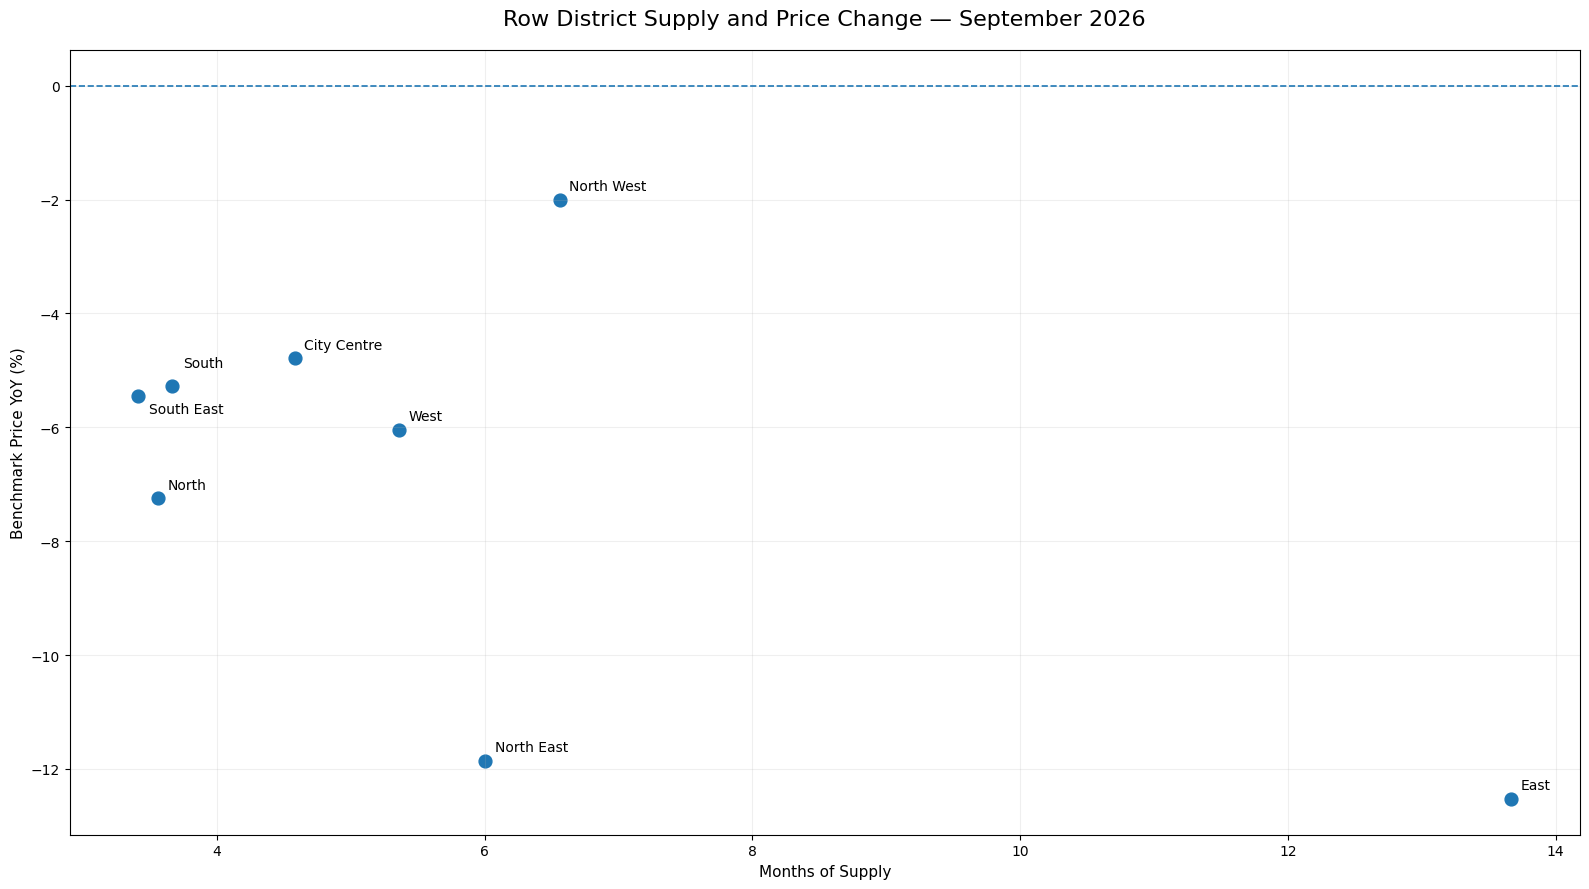
Geographic differences were equally important. Months of supply ranged from 3.41 in the South East to 13.67 in the East, and every district recorded a lower benchmark price than a year earlier. The size of those declines did not move mechanically with supply: the North West had 6.56 months of supply but only a 2.01% annual benchmark-price decline, while the North East had 6.00 months and an 11.86% decline. For buyers and sellers, the evidence supports using the overall buyer’s-market context together with current price-range and district comparables rather than assuming one condition applies everywhere.
Row Market at a Glance
How the Row Market Is Changing
The 13-month pattern shows a Row market that became more active through the first half of 2026 before losing momentum late in the summer. Sales were 303 in September 2025, fell to 171 by December, then recovered to a spring high of 363 in April 2026. Activity remained comparatively firm in May and June, but sales eased to 286 in July, 284 in August and 248 in September. That September total was 18.2% below the same month a year earlier.
New listings followed a similar seasonal arc but remained materially higher than sales through much of the spring and early summer. They climbed from 505 in January to 697 in May, then moderated to 609 in June and roughly 500 in July and August before rising to 552 in September. September new listings were 6.3% below a year earlier, a smaller decline than the drop in sales. The relationship matters because fewer sales relative to incoming listings gives available supply more room to persist.
Inventory reflects that accumulation. It fell to 654 in December 2025, then rebuilt steadily and reached 1,174 in May 2026. Inventory remained above 1,100 through July, dipped to 1,095 in August and edged back to 1,103 in September. Compared with September 2025, inventory was 0.7% higher even though sales were substantially lower. Months of supply therefore rose to 4.45, above the 4.0 threshold used by the report to classify the overall Row market as a buyer’s market.
Price movement has been consistent with the softer balance. The benchmark price moved from $436,600 in September 2025 to $412,400 in September 2026, a 5.5% year-over-year decline. More recently it slipped from $424,100 in June to $418,500 in July, $415,200 in August and $412,400 in September. The main trajectory is therefore not simply higher inventory: it is the combination of slower sales, sustained listing supply and a benchmark price that continued to ease as the market moved further toward buyer choice.
Where the Row Market Is Diverging
Price-range results show that September’s weaker city-wide sales total was not shared evenly. The clearest exception was the $300,000-$399,999 range, where official CREB sales increased to 89 from 83 a year earlier, a 7.2% gain. Every other governed price range recorded fewer sales. Under $300,000 fell to 29 sales from 37, while the $400,000-$499,999 range declined to 76 from 98. The $500,000-$599,999 range eased to 33 from 38, and the $800,000-plus range recorded 8 sales compared with 10 a year earlier.
The sharpest sales contraction occurred from $600,000 to $799,999. Sales fell to 13 from 37, a 64.9% year-over-year decline. That makes the middle-upper price range the most pronounced area of weakness in the September comparison. By contrast, the two ranges between $300,000 and $499,999 still produced the largest sales counts, with 89 and 76 transactions respectively, so the centre of Row activity remained concentrated in those familiar price levels even though only the lower of the two improved year over year.
Listing-derived new-listing evidence adds another layer. New listings increased year over year only below $300,000, rising to 52 from 45. They declined modestly in the $300,000-$399,999, $400,000-$499,999 and $500,000-$599,999 ranges, and fell more noticeably from $600,000 to $799,999. At $800,000 and above, new listings were unchanged at 18. These changes did not produce a uniform supply picture because the current Active-only counts remained largest in the $400,000-$499,999 range at 345 and the $300,000-$399,999 range at 306.
Taken together, the range data separates two ideas that can otherwise be blurred in the city-wide totals. Sales momentum was relatively resilient from $300,000 to $399,999, but buyers still had a substantial pool of Active listings in that range. From $400,000 to $499,999, active supply was even larger while sales were lower than a year earlier. Above $600,000, sales were much thinner and active counts were smaller in absolute terms. The result is a Row market with meaningful price-range differences rather than one uniform pattern of demand and available choice.
| Price Range | Sales | Sales YoY | New Listings | New Listings YoY | Active Listings |
|---|---|---|---|---|---|
| Under $300,000 | 29 | -21.6% | 52 | +15.6% | 107 |
| $300,000-$399,999 | 89 | +7.2% | 132 | -9.6% | 306 |
| $400,000-$499,999 | 76 | -22.4% | 198 | -10.0% | 345 |
| $500,000-$599,999 | 33 | -13.2% | 96 | -6.8% | 163 |
| $600,000-$799,999 | 13 | -64.9% | 53 | -17.2% | 87 |
| $800,000+ | 8 | -20.0% | 18 | 0.0% | 32 |
Sales and Sales YoY are official CREB® evidence. New Listings, New Listings YoY and Active Listings are derived from supplied Pillar 9™ MLS® records. Active Listings is an Active-only listing-level count and is not official CREB Inventory.
Geographic Differences
District conditions were also widely dispersed in September. Months of supply ranged from 3.41 in the South East, 3.56 in the North and 3.66 in the South to 6.00 in the North East and 6.56 in the North West. The East was the clear outlier at 13.67 months of supply, although that reading came with only three sales and 41 units of inventory, so its ratio is based on a much smaller level of monthly activity than the larger districts.
Benchmark prices were lower year over year in every district, but the size of the decline varied considerably. The East recorded the largest decrease at 12.53%, followed by the North East at 11.86%. The North was down 7.25%, while the West, South and South East were down between 5% and 6%. The North West had the mildest decline at 2.01%, despite carrying 6.56 months of supply.
That contrast is important because supply and annual price change do not move in a simple one-for-one relationship across districts. The North West and North East had similarly elevated supply but very different year-over-year price movements, while the South East combined the lowest months of supply with a mid-range price decline. Geographic evidence therefore supports a city-wide softening picture while also showing that the degree of supply pressure and price adjustment differs materially by district.
| District | Sales | Inventory | Months of Supply | Benchmark Price | Benchmark Price YoY |
|---|---|---|---|---|---|
| City Centre | 36 | 165 | 4.58 | $566,200 | -4.79% |
| North East | 24 | 144 | 6.00 | $326,100 | -11.86% |
| North | 50 | 178 | 3.56 | $373,400 | -7.25% |
| North West | 18 | 118 | 6.56 | $434,000 | -2.01% |
| West | 22 | 118 | 5.36 | $439,600 | -6.05% |
| South | 50 | 183 | 3.66 | $369,200 | -5.28% |
| South East | 44 | 150 | 3.41 | $421,300 | -5.45% |
| East | 3 | 41 | 13.67 | $258,300 | -12.53% |
What Is Driving the Row Market
The internal mechanics behind September’s Row market balance are most visible in the relationship between sales and available supply. Sales were down 18.2% year over year while new listings were down only 6.3% and inventory was slightly higher. That gap means demand, as measured by completed sales, weakened more than the flow and stock of listings. The resulting 4.45 months of supply moved the overall Row market into the report’s buyer’s-market range.
The price-range evidence reinforces that interpretation. The $300,000-$399,999 range was the only band to post higher sales than a year earlier, but it still had 306 Active listings. The $400,000-$499,999 range carried the largest Active count at 345 while sales declined. From $600,000 to $799,999, the steep sales drop occurred alongside 87 Active listings. These are different segment patterns, but each shows why city-wide balance cannot be understood from sales totals alone.
District results add a second layer of variation. Some areas had months of supply near the mid-three range, while others were above six and the East was much higher. Yet benchmark-price declines did not line up mechanically with those supply readings. The most supportable explanation is therefore broad rather than causal: softer sales relative to available listings has increased buyer choice overall, while the strength of that effect differs by price range and district.
What This Means for Buyers and Sellers
For Row buyers, September’s evidence points to more choice and less uniform competition than a year earlier. The overall market had 4.45 months of supply, sales were lower, and inventory was slightly higher. That combination can create more opportunity to compare alternatives, especially where Active listing counts are substantial. The $300,000-$499,999 ranges had the largest pools of Active listings, so buyers shopping in those bands may encounter more selection even though the $300,000-$399,999 range also showed stronger sales than a year earlier.
The district data matters because the same budget can face different supply conditions depending on location. Months of supply was in the mid-three range in the South East, North and South, but above six in the North East and North West. Those differences do not guarantee a particular negotiating outcome, and the East’s very high ratio is based on only three sales, but they show why current district-level evidence is relevant when judging how much choice is actually available.
For sellers, the city-wide benchmark price was 5.5% lower than a year earlier and every district showed a negative annual benchmark-price change. That makes current comparable evidence particularly important. A Row home is not competing only with the city-wide average; it competes with available alternatives in its price range and location. Where active supply is deeper or sales have weakened more sharply, pricing that is not well aligned with current comparables may face greater resistance.
Neither side should treat the overall buyer’s-market classification as a description of every individual transaction. The report does not assign market-status labels to price ranges or districts, and the underlying evidence shows why. The $300,000-$399,999 range had rising sales, the North West had relatively mild annual price decline despite elevated supply, and lower-supply districts still recorded price decreases. The practical takeaway is to use the overall market state as context, then narrow the comparison to the relevant price range and district.
What to Watch Next
First, watch whether the gap between sales and new listings narrows. If sales stabilize or rise while new listings continue to moderate, inventory pressure could ease; if sales remain weak relative to incoming listings, the current level of buyer choice could persist or increase.
Second, monitor whether inventory stays near or above the 1,100 level and how that affects months of supply. A sustained move back below the 4.0 threshold would materially change the overall market classification, while a continued reading above 4.0 would confirm that the Row market remains in buyer’s-market territory under the governed framework.
Finally, watch whether weakness above $600,000 broadens or begins to recover, and whether the high-supply North East, North West and East districts converge toward the rest of the city. Those changes would matter because the current report shows that segment and district differences are a major part of September’s market picture.
Explore the Market in More Detail
Sources and Methodology
Official CREB® City of Calgary Monthly Statistics are the authoritative source for the Row benchmark price, sales, new listings, inventory, months of supply, the 13-month activity series, price-range sales and the eight district measures used in this report. The overall market status is derived from official Row months of supply: below 2.5 is a seller’s market, 2.5 to 4.0 is balanced, and above 4.0 is a buyer’s market.
Price-range New Listings and current Active Listings are calculated from the supplied Pillar 9™ MLS® records after applying the exact Row/Townhouse property-subtype filter. New Listings are grouped by Original List Price for September 2026 and September 2025. Active Listings are current records with MLS status Active only and are grouped by Current Price. This Active Listings measure is not the same as official CREB Inventory.
The supplied listing dataset was validated for required fields, duplicate listing IDs, the governed September and prior-year cohorts, required date and price validity, and exact price-band assignment. Historical upstream extraction counts and no-truncation audit evidence were not available, so no claim is made that this production run independently certifies completeness of the upstream Pillar 9 database. CREB remains authoritative where the two sources provide comparable measures.