
Calgary's Semi-Detached market remained balanced in August 2026, but the balance shifted toward more supply relative to sales. Official CREB data show sales falling more sharply than new listings while inventory increased from a year earlier. This report traces the 13-month trajectory, examines price-range differences in sales and current listing supply, and compares district-level supply and benchmark-price movement behind the city-wide result.
Executive Summary
Calgary's Semi-Detached market remained in a Balanced Market position in August 2026, but conditions shifted toward more supply relative to sales. Official CREB statistics recorded 168 sales, down 18.45% from August 2025, while new listings declined only 2.58% and inventory increased 4.91% to 555. That combination lifted Months of Supply from 2.57 to 3.30, a 28.65% year-over-year increase. The benchmark price was $690,500, 0.98% above a year earlier, showing that the softer current balance did not translate into a negative annual benchmark comparison at the city-wide level.
The 13-month trajectory shows a late-2025 contraction followed by a broad recovery through spring 2026, then a summer slowdown in sales while inventory remained comparatively elevated. Price-range evidence shows that the slowdown was concentrated most heavily from $600,000 through $999,999. Sales fell 30.4% in the $600,000-$799,999 range and 25.7% from $800,000-$999,999, while the latter range also recorded a 76.7% increase in listing-derived new listings. In contrast, sales at $1,000,000+ increased 11.8%.
Geographic conditions were also uneven. South East had the lowest district Months of Supply at 1.83, while East reached 10.67 on only three sales; North East stood at 4.10 and had the largest benchmark decline at 6.02%. North West, City Centre and West all recorded positive annual benchmark movement. For buyers and sellers, the key implication is that the city-wide Balanced Market classification is useful context, but price range, district and the immediate comparable set materially change the competitive environment.
Semi-Detached Market at a Glance
Source: CREB® City of Calgary Monthly Statistics, August 2026. Market Status is derived only from official Semi-Detached Months of Supply.
How the Semi-Detached Market Is Changing
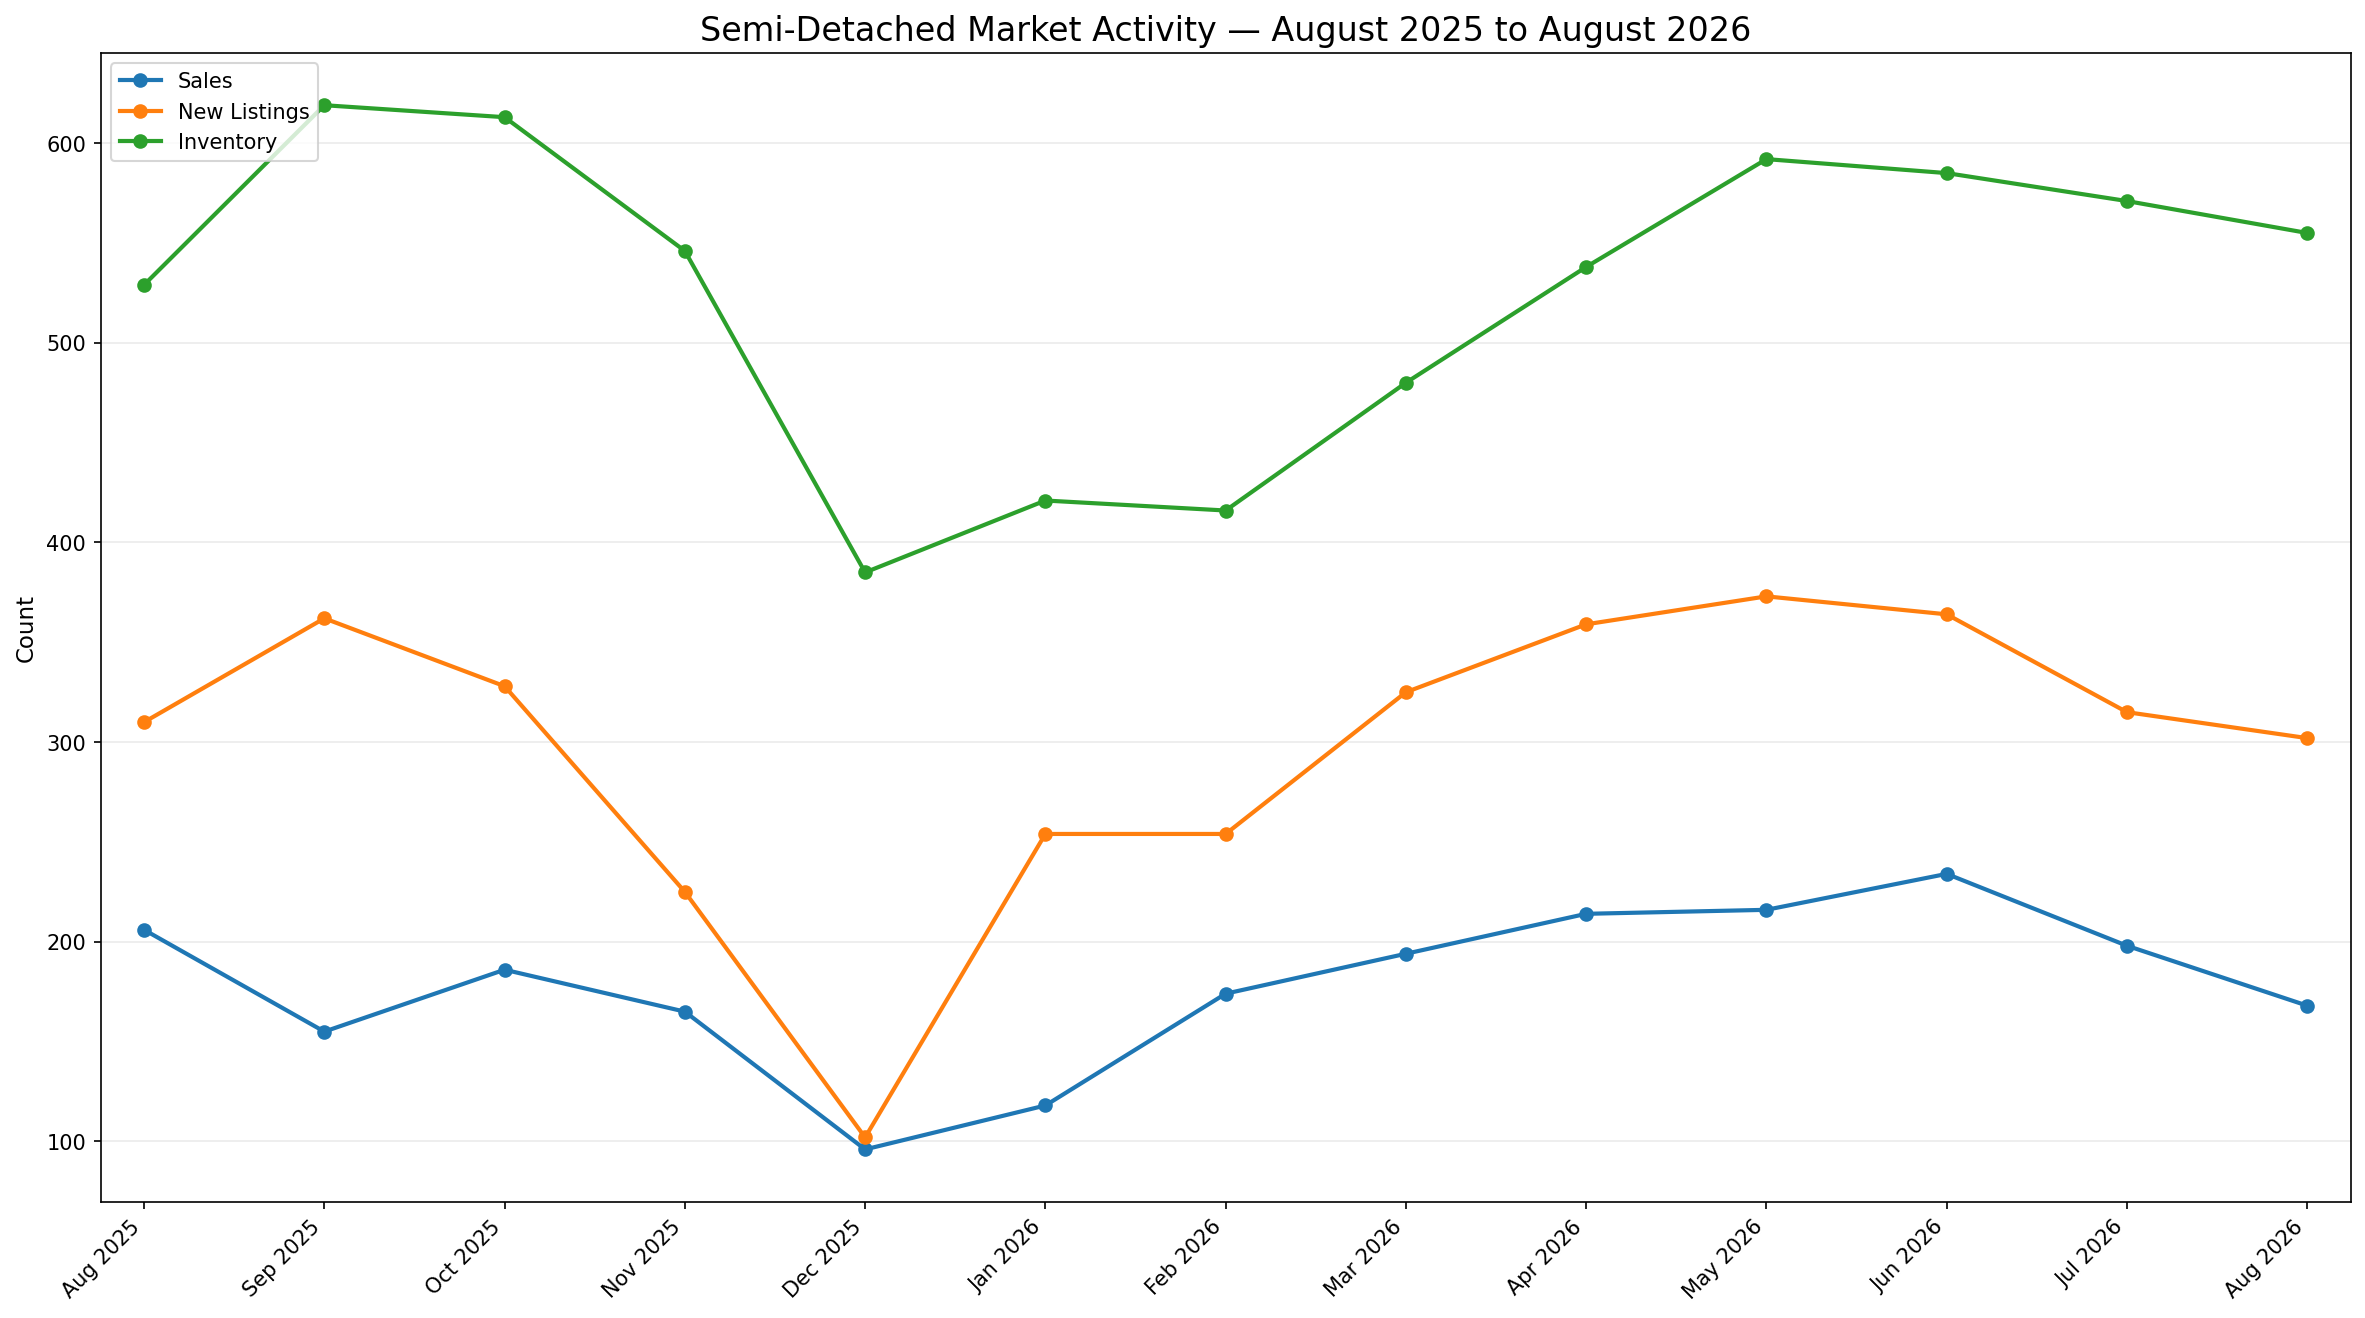
The 13-month CREB series shows Calgary's Semi-Detached market moving through a late-2025 contraction, a broad spring recovery and then a softer summer finish. In August 2025, the segment recorded 206 sales, 310 new listings and 529 units of inventory. Sales then dropped through the autumn and reached 96 in December, while new listings fell to 102 and inventory declined to 385. The first half of 2026 reversed much of that contraction: sales climbed to 234 by June, new listings reached a May high of 373, and inventory rebuilt to 592 in May before easing slightly.
The summer sequence changed the relationship again. Sales declined from 234 in June to 198 in July and 168 in August. New listings also moderated, but less abruptly, moving from 364 in June to 315 in July and 302 in August. Inventory remained comparatively elevated, slipping from 585 in June to 571 in July and 555 in August. The result is that August carried more available supply against a slower pace of completed sales than the same month a year earlier.
The year-over-year comparison makes that shift clearer. August sales were 18.45% below August 2025, while new listings were down only 2.58% and inventory was 4.91% higher. Official Months of Supply therefore increased from 2.57 to 3.30, a 28.65% rise, while the benchmark price was $690,500, 0.98% above last August. The benchmark's positive annual comparison alongside a higher supply reading shows that current market balance and annual price movement are related but distinct signals.
Taken together, the trajectory points to a market that recovered materially from the winter low but entered late summer with demand activity easing faster than available supply. The city-wide classification remains Balanced, yet the August relationship gives buyers more choice relative to the sales pace than they had one year earlier.
Where the Semi-Detached Market Is Diverging
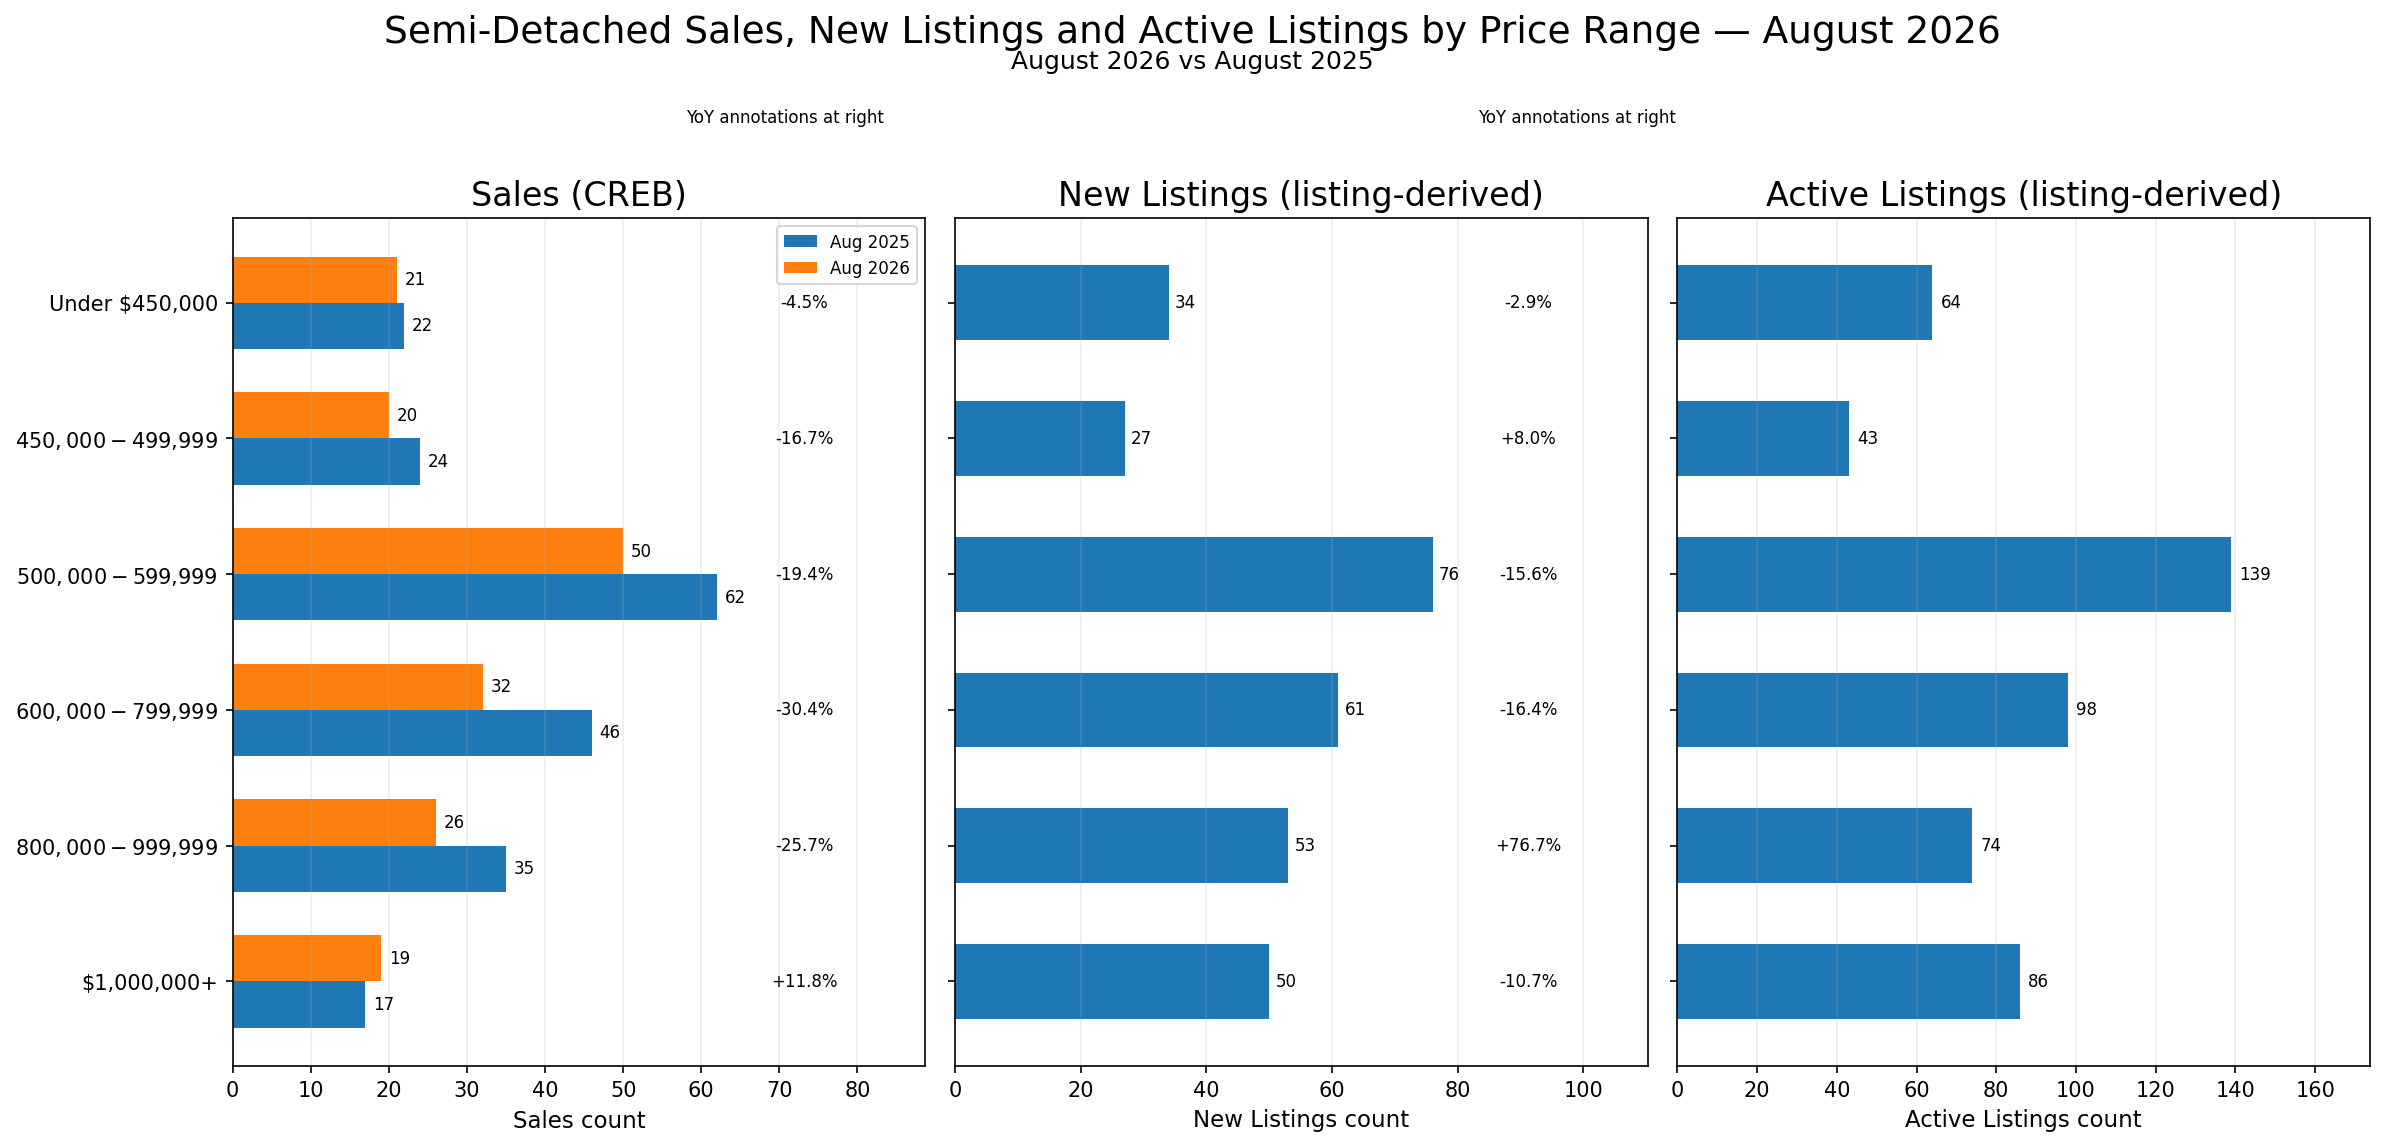
Price-range evidence shows that the August slowdown was broad, but not uniform. Official CREB sales were lower year over year in five of the six governed ranges. The largest decline occurred from $600,000-$799,999, where sales fell from 46 to 32, down 30.4%. Sales in the $800,000-$999,999 range fell 25.7%, and the $500,000-$599,999 range declined 19.4%. At the lower end, sales under $450,000 were almost unchanged at 21 compared with 22 a year earlier. The exception was $1,000,000+, where sales increased from 17 to 19, up 11.8%.
Listing-derived new-listing flow adds a different layer. New listings were almost flat under $450,000 and increased 8.0% from $450,000-$499,999. They declined 15.6% in the $500,000-$599,999 range and 16.4% from $600,000-$799,999. The sharpest contrast was $800,000-$999,999: sales were down 25.7%, but new listings rose from 30 to 53, an increase of 76.7%. At $1,000,000+, sales increased even though new listings were 10.7% lower.
Current Active Listings were also distributed unevenly. The largest Active count was 139 in the $500,000-$599,999 range, followed by 98 from $600,000-$799,999 and 86 at $1,000,000+. The $800,000-$999,999 range had 74 Active Listings after the large year-over-year increase in new-listing flow. These are current listing-level counts, not official CREB Inventory.
The useful pattern is therefore not simply that sales declined. Several middle and upper-middle ranges combined weaker sales with meaningful current listing choice, while the million-dollar-plus range maintained positive sales growth. Buyers and sellers should read the city-wide balance through the price band that actually matches the property or search. The table therefore provides context that the overall subtype totals cannot show on their own.
| Price Range | Sales | Sales YoY | New Listings | New Listings YoY | Active Listings |
|---|---|---|---|---|---|
| Under $450,000 | 21 | -4.5% | 34 | -2.9% | 64 |
| $450,000-$499,999 | 20 | -16.7% | 27 | +8.0% | 43 |
| $500,000-$599,999 | 50 | -19.4% | 76 | -15.6% | 139 |
| $600,000-$799,999 | 32 | -30.4% | 61 | -16.4% | 98 |
| $800,000-$999,999 | 26 | -25.7% | 53 | +76.7% | 74 |
| $1,000,000+ | 19 | +11.8% | 50 | -10.7% | 86 |
Sales and Sales YoY are official CREB® Semi-Detached measures. New Listings, New Listings YoY and Active Listings are derived from supplied Pillar 9™ MLS® records. Active Listings is an Active-only listing count and is not CREB Inventory.
Geographic Differences
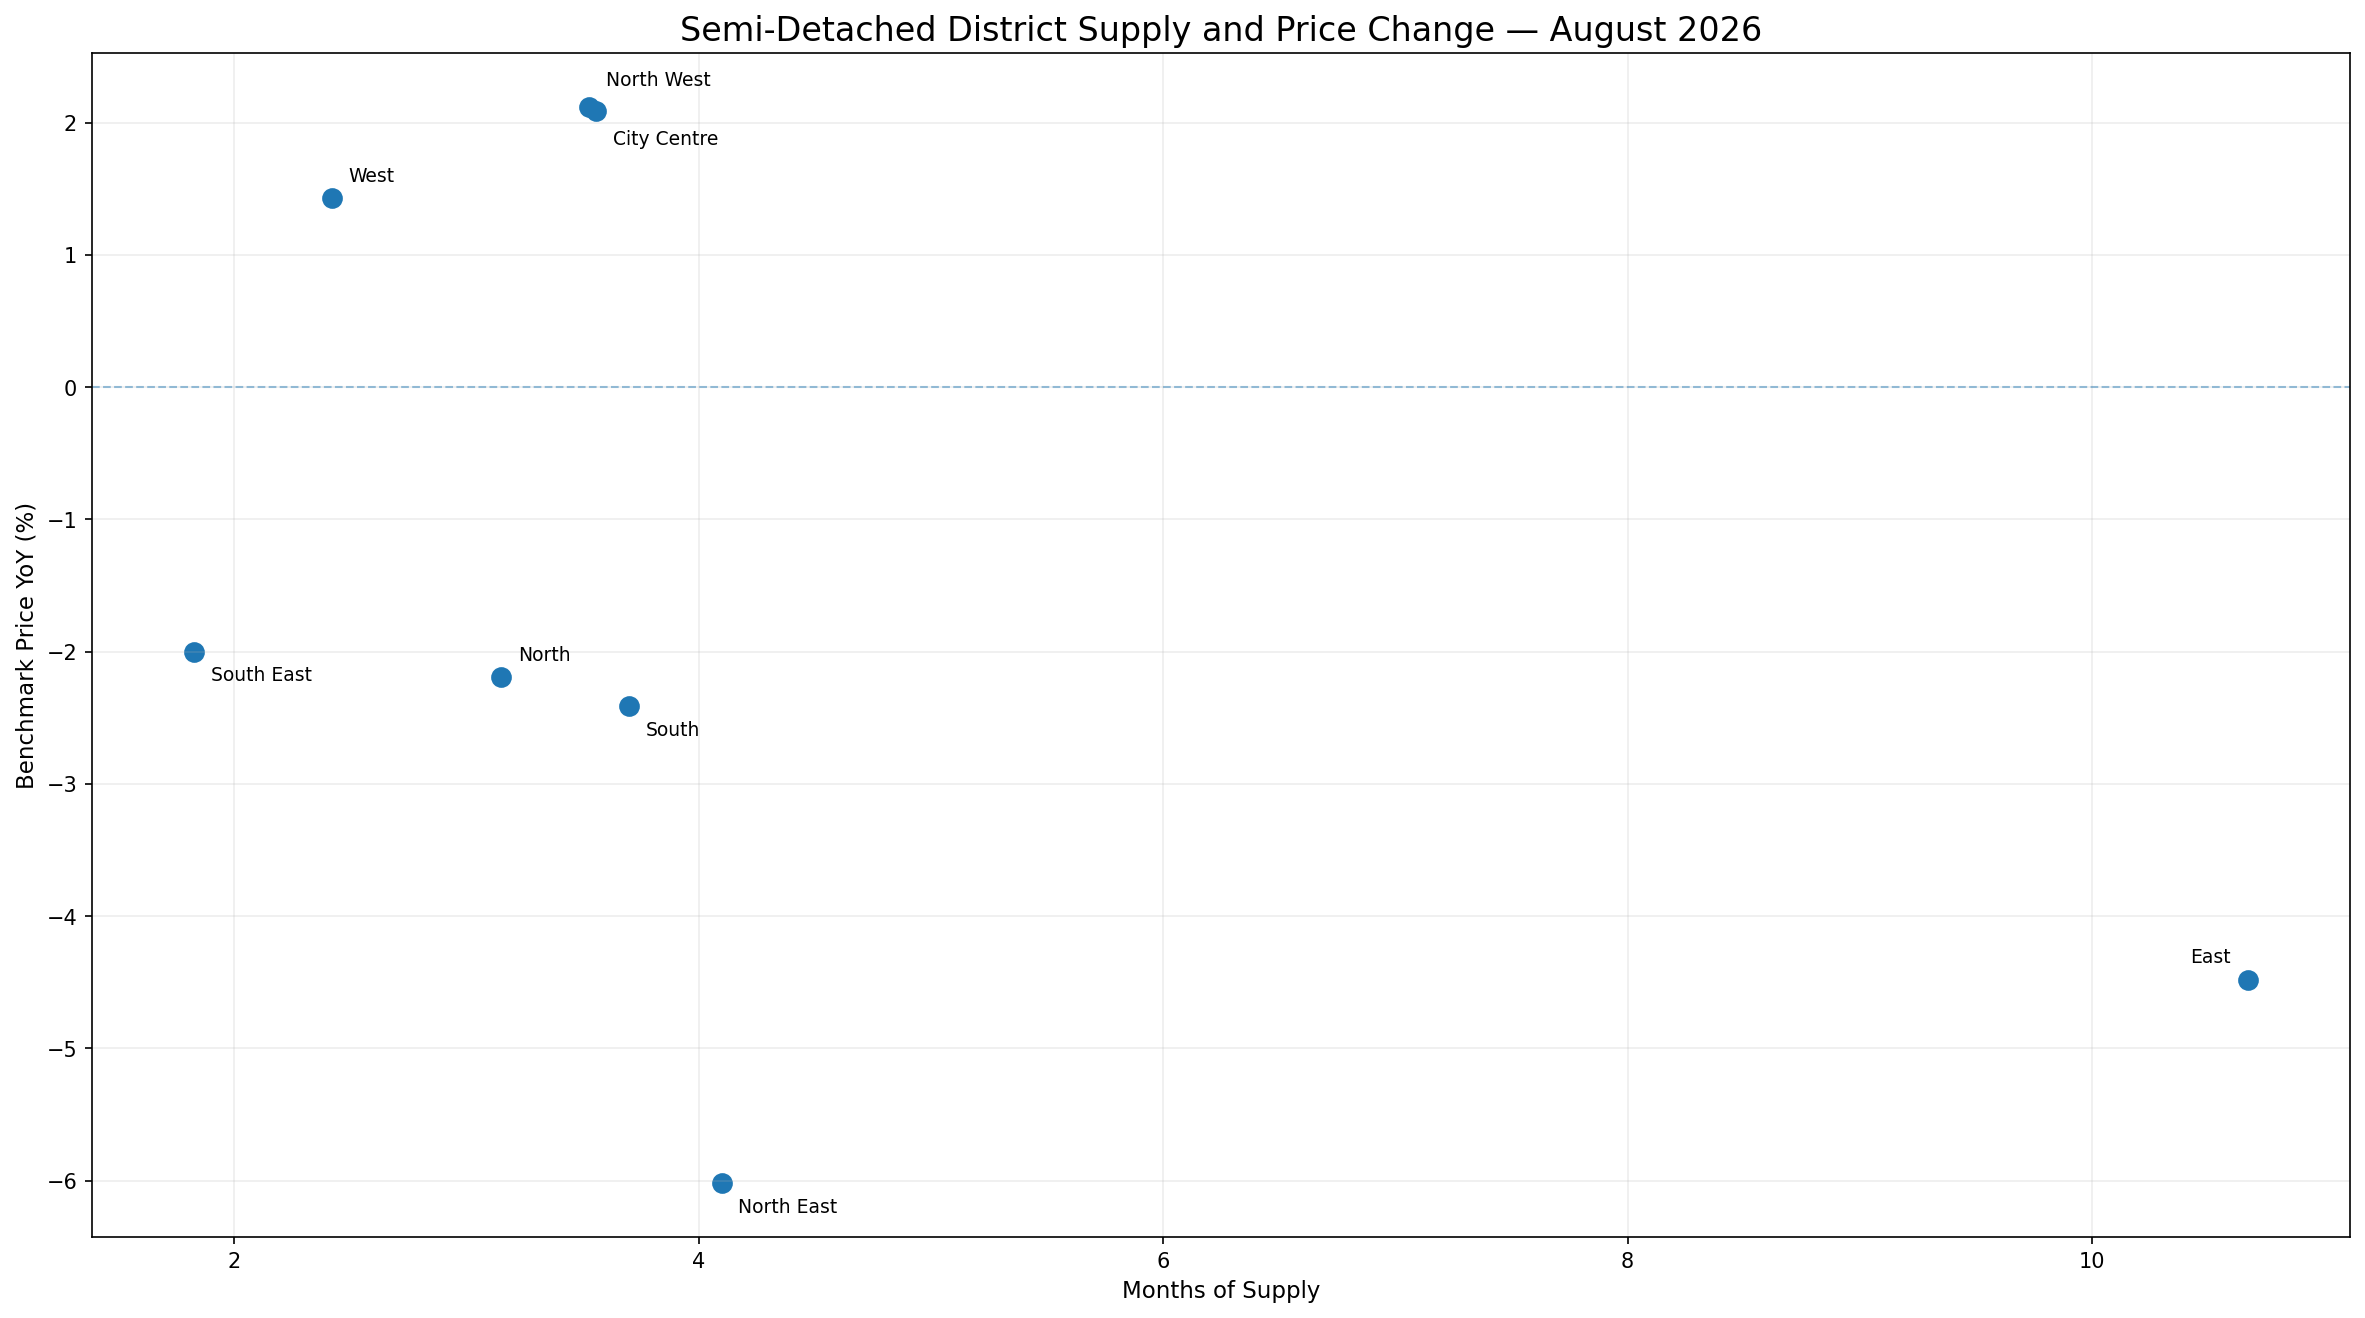
Semi-Detached conditions varied widely across Calgary's eight CREB districts in August. South East recorded the lowest Months of Supply at 1.83, followed by West at 2.42. North, North West and City Centre clustered between 3.15 and 3.56, while South stood at 3.70 and North East at 4.10. East was the clear outlier at 10.67 Months of Supply, based on 32 units of inventory and only three August sales.
Annual benchmark-price movement did not line up mechanically with those supply readings. North West had the strongest increase at +2.12%, City Centre was close behind at +2.09%, and West was +1.43%. South East, despite the lowest Months of Supply, had a benchmark price 2.00% below a year earlier. North and South were also negative, while North East posted the largest decline at -6.02%. East was down 4.48%.
The spread matters because the city-wide 3.30 Months of Supply is only an aggregate. A property in South East or West is being compared with a different current supply setting from one in North East or East. At the same time, the benchmark results show why supply duration should not be treated as a direct explanation for annual price movement. District context is most useful when both measures are considered together.
| District | Sales | Inventory | Months of Supply | Benchmark Price | Benchmark Price YoY |
|---|---|---|---|---|---|
| City Centre | 41 | 146 | 3.56 | $965,700 | +2.09% |
| North East | 20 | 82 | 4.10 | $423,300 | -6.02% |
| North | 20 | 63 | 3.15 | $492,300 | -2.19% |
| North West | 15 | 53 | 3.53 | $680,600 | +2.12% |
| West | 19 | 46 | 2.42 | $824,000 | +1.43% |
| South | 20 | 74 | 3.70 | $529,400 | -2.41% |
| South East | 29 | 53 | 1.83 | $509,400 | -2.00% |
| East | 3 | 32 | 10.67 | $377,400 | -4.48% |
Source: CREB® City of Calgary Monthly Statistics, August 2026.
What Is Driving the Semi-Detached Market
The main internal mechanism in August was the change in the relationship between sales activity and available supply. Semi-Detached sales fell 18.45% from a year earlier, but new listings declined only 2.58% and inventory increased 4.91%. With fewer transactions absorbing a slightly larger inventory base, official Months of Supply rose to 3.30 from 2.57. That is the clearest reason the city-wide balance became more buyer-favouring while remaining within the governed Balanced Market range.
The price-range evidence shows that this shift was concentrated rather than uniform. Sales declines were strongest from $600,000 through $999,999, and the $800,000-$999,999 range simultaneously received substantially more new listings than a year earlier. By contrast, sales under $450,000 were nearly unchanged and sales at $1,000,000+ increased. Current Active Listings were substantial across several middle and higher ranges, reinforcing the importance of segment-specific competition.
Geography adds a second source of variation. District Months of Supply ranged from 1.83 to 10.67, yet positive annual benchmark movement appeared in districts with different supply levels. The report therefore supports an explanation based on uneven interaction between sales pace and available supply across price ranges and districts, rather than one uniform condition applying to every Semi-Detached property.
What This Means for Buyers and Sellers
For Semi-Detached buyers, August's city-wide 3.30 Months of Supply indicates more choice relative to the sales pace than a year earlier, but the price-range evidence shows that the amount of choice is not evenly distributed. The $500,000-$599,999 range had the largest current Active count at 139 while official sales were down 19.4% year over year. The $600,000-$799,999 and $800,000-$999,999 ranges also recorded sizable sales declines and meaningful current Active supply. In those segments, buyers may have a broader set of competing listings to compare than the city-wide label alone suggests.
Other ranges present a different context. Sales under $450,000 were almost unchanged from last August, while $1,000,000+ sales increased 11.8% even though new-listing flow was lower. Those patterns do not imply that every property in the range will face the same competition, but they demonstrate why budget level changes the evidence a buyer should use.
District conditions add another layer. South East and West had much lower Months of Supply than North East, while East's 10.67 reading reflected a very small monthly sales count. Buyers comparing otherwise similar homes in different parts of Calgary should therefore use current district and property-specific comparables rather than applying the overall 3.30 figure uniformly.
For sellers, the same segmentation affects pricing sensitivity and the strength of competing alternatives. A Balanced Market does not remove the need to position a property against the listings and recent sales that buyers can actually choose from. Ranges with weaker sales and larger active counts can create more comparison pressure, while tighter districts or ranges with steadier activity may present a different competitive setting. The practical use of the August report is to start with the city-wide condition and then narrow the analysis to the property's price range, district and immediate comparable set.
What to Watch Next
First, watch the relationship between Semi-Detached sales and inventory. If sales stabilize while inventory declines, Months of Supply would move back toward a tighter balance; if sales remain weak while inventory holds or rises, buyer choice would continue to expand.
Second, monitor the $600,000-$999,999 ranges. A recovery in sales or a moderation of the large new-listing increase in the $800,000-$999,999 band would narrow the current price-range divergence; continued weakness would reinforce it.
Finally, compare district Months of Supply with Benchmark Price YoY. If higher-supply districts such as North East and East tighten while annual declines moderate, geographic dispersion would narrow. If the spread persists or widens, the city-wide average will remain a less complete description of local Semi-Detached conditions.
Explore the Market in More Detail
Sources and Methodology
Official CREB® City of Calgary Monthly Statistics are used for the Semi-Detached benchmark price, sales, new listings, inventory, months of supply, the 13-month activity series, Semi-Detached sales by price range, and the district measures shown in this report.
Pillar 9™ MLS® System records supplied for this report are used only for New Listings and New Listings YoY by price range, current Active Listings by price range, and diagnostic source reconciliation. Price-range New Listings are grouped by Original List Price. Active Listings use Current Price and include Active status only; Pending listings are excluded. These Active Listings counts are not the official CREB Inventory measure.
The overall Semi-Detached Market Status is based on official city-wide Semi-Detached Months of Supply: below 2.5 is a Seller's Market, 2.5 through 4.0 is a Balanced Market, and above 4.0 is a Buyer's Market. Price-range and district evidence is presented descriptively and is not assigned separate market classifications.