
Calgary’s Semi-Detached market remained balanced in September 2026, with 3.67 months of supply. Sales were 5.2% higher than a year earlier while inventory was 3.2% lower, yet the benchmark price was essentially unchanged at $685,200. Beneath that stable city-wide headline, activity differed sharply by price range and district. This report traces the 13-month trajectory and the segments shaping current conditions.
Executive Summary
Calgary’s Semi-Detached market remained balanced in September 2026, but the headline stability masks two different time frames. Official CREB statistics recorded 163 sales, up 5.16% from September 2025, while new listings were nearly unchanged and inventory was 3.23% lower. That reduced Months of Supply from 3.99 to 3.67 year over year. More recently, however, sales eased after the June high while September new listings rebounded and inventory rose from August. The benchmark price was $685,200, only 0.09% above a year earlier after easing from its June peak.
Price-range activity was sharply divided. Sales rose 69.2% from $450,000-$499,999 and 34.6% from $600,000-$799,999, while sales under $450,000 fell 34.5% and $800,000-$999,999 declined 12.5%. Listing flows often moved in the opposite direction: new listings under $450,000 increased 58.8%, while the $450,000-$499,999 and $600,000-$799,999 ranges received fewer new listings. Current Active counts were highest from $500,000-$599,999, at $1,000,000+, and from $600,000-$799,999.
Geographic conditions were just as uneven. North East had 7.89 months of supply and the largest annual benchmark decline at 6.02%, while West had 5.18 months of supply and the strongest benchmark increase at 1.46%. South had the lowest supply reading at 2.50 but a negative annual benchmark comparison. For buyers and sellers, the central implication is that the city-wide Balanced Market classification is useful context, but price range, district and the immediate comparable set materially change the competitive setting.
Semi-Detached Market at a Glance
Source: CREB® City of Calgary Monthly Statistics, September 2026. Market Status is derived only from official Semi-Detached Months of Supply using the governed Calgary market-status thresholds.
How the Semi-Detached Market Is Changing
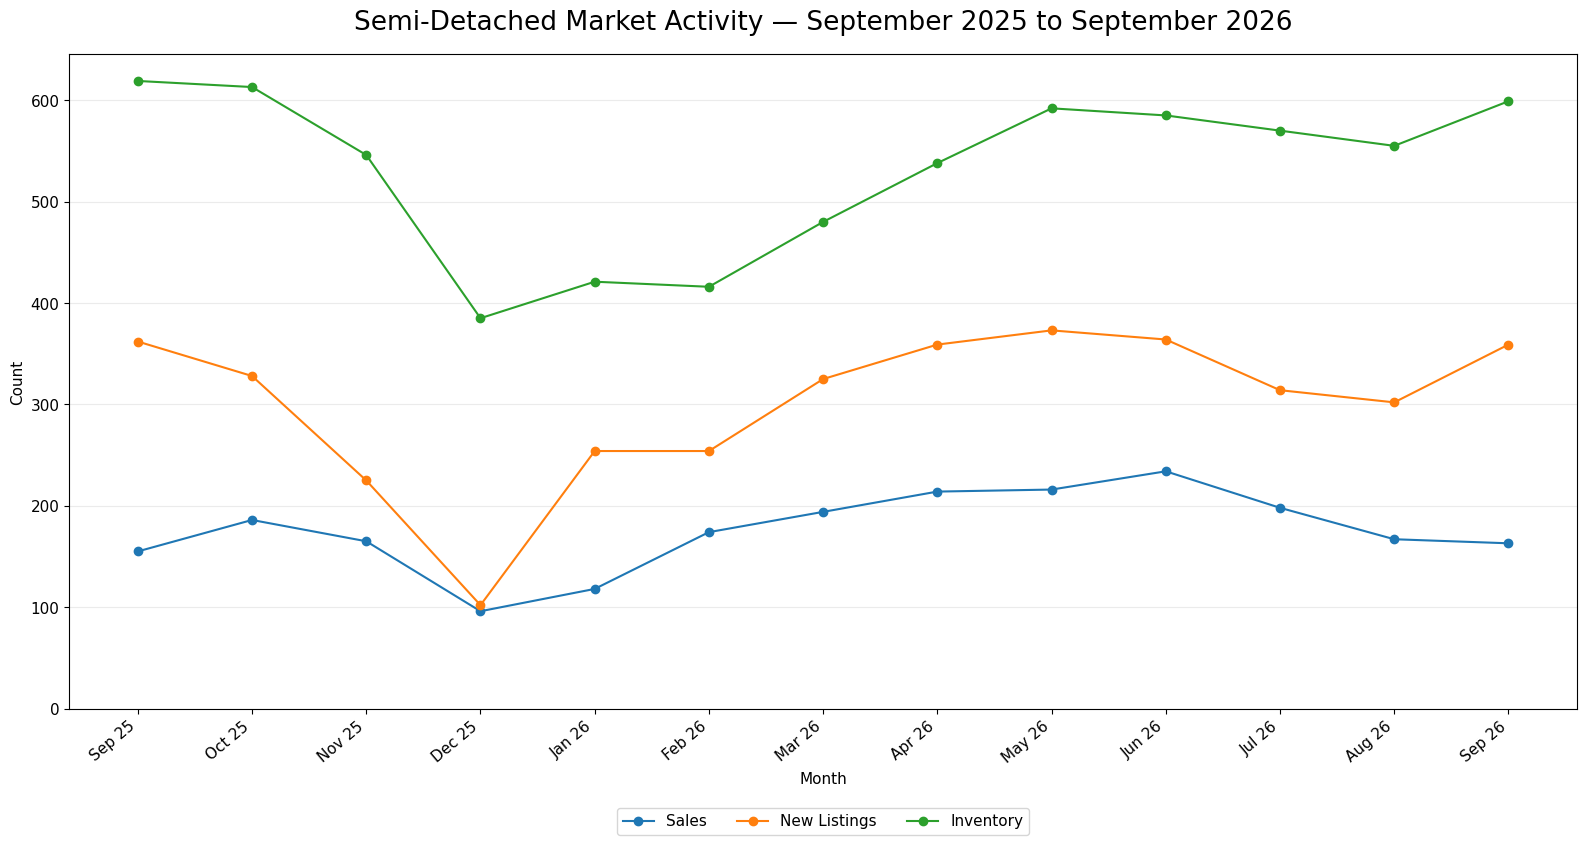
The 13-month CREB series shows a market that contracted through late 2025, rebuilt through the first half of 2026 and then lost some sales momentum after June. September 2025 began the period with 155 sales, 362 new listings and 619 units of inventory. Activity then fell into year-end: sales reached 96 in December, new listings fell to 102 and inventory declined to 385. The early months of 2026 reversed that contraction. Sales climbed to 234 by June, while new listings reached 373 in May and inventory rose to 592.
The pattern changed during summer. Sales stepped down from 234 in June to 198 in July, 167 in August and 163 in September. New listings declined through August but then rebounded to 359 in September, nearly matching the 362 recorded one year earlier. Inventory followed a different path: after easing from 592 in May to 555 in August, it rose again to 599 in September. The September snapshot therefore combined a sales pace that had flattened after the summer decline with a renewed inflow of listings and a larger inventory base than in August.
Year over year, however, September was somewhat tighter than September 2025. Sales were 5.16% higher, new listings were 0.83% lower and inventory was 3.23% lower. Official Months of Supply was 3.67 compared with 3.99 a year earlier, keeping the subtype within the governed Balanced Market range. That annual comparison differs from the recent month-to-month direction, where inventory rose while sales edged lower. Both time frames matter: one shows modest tightening from a year ago, while the other shows supply rebuilding at the end of summer.
The benchmark-price path adds another distinction. It rose from $663,700 in December to $694,600 in June, then eased to $685,200 by September. The September benchmark was only 0.09% above the prior year. The trajectory therefore points to a balanced market in which the sales-and-supply relationship changed meaningfully during the year even though the annual benchmark-price comparison ended almost flat.
Where the Semi-Detached Market Is Diverging
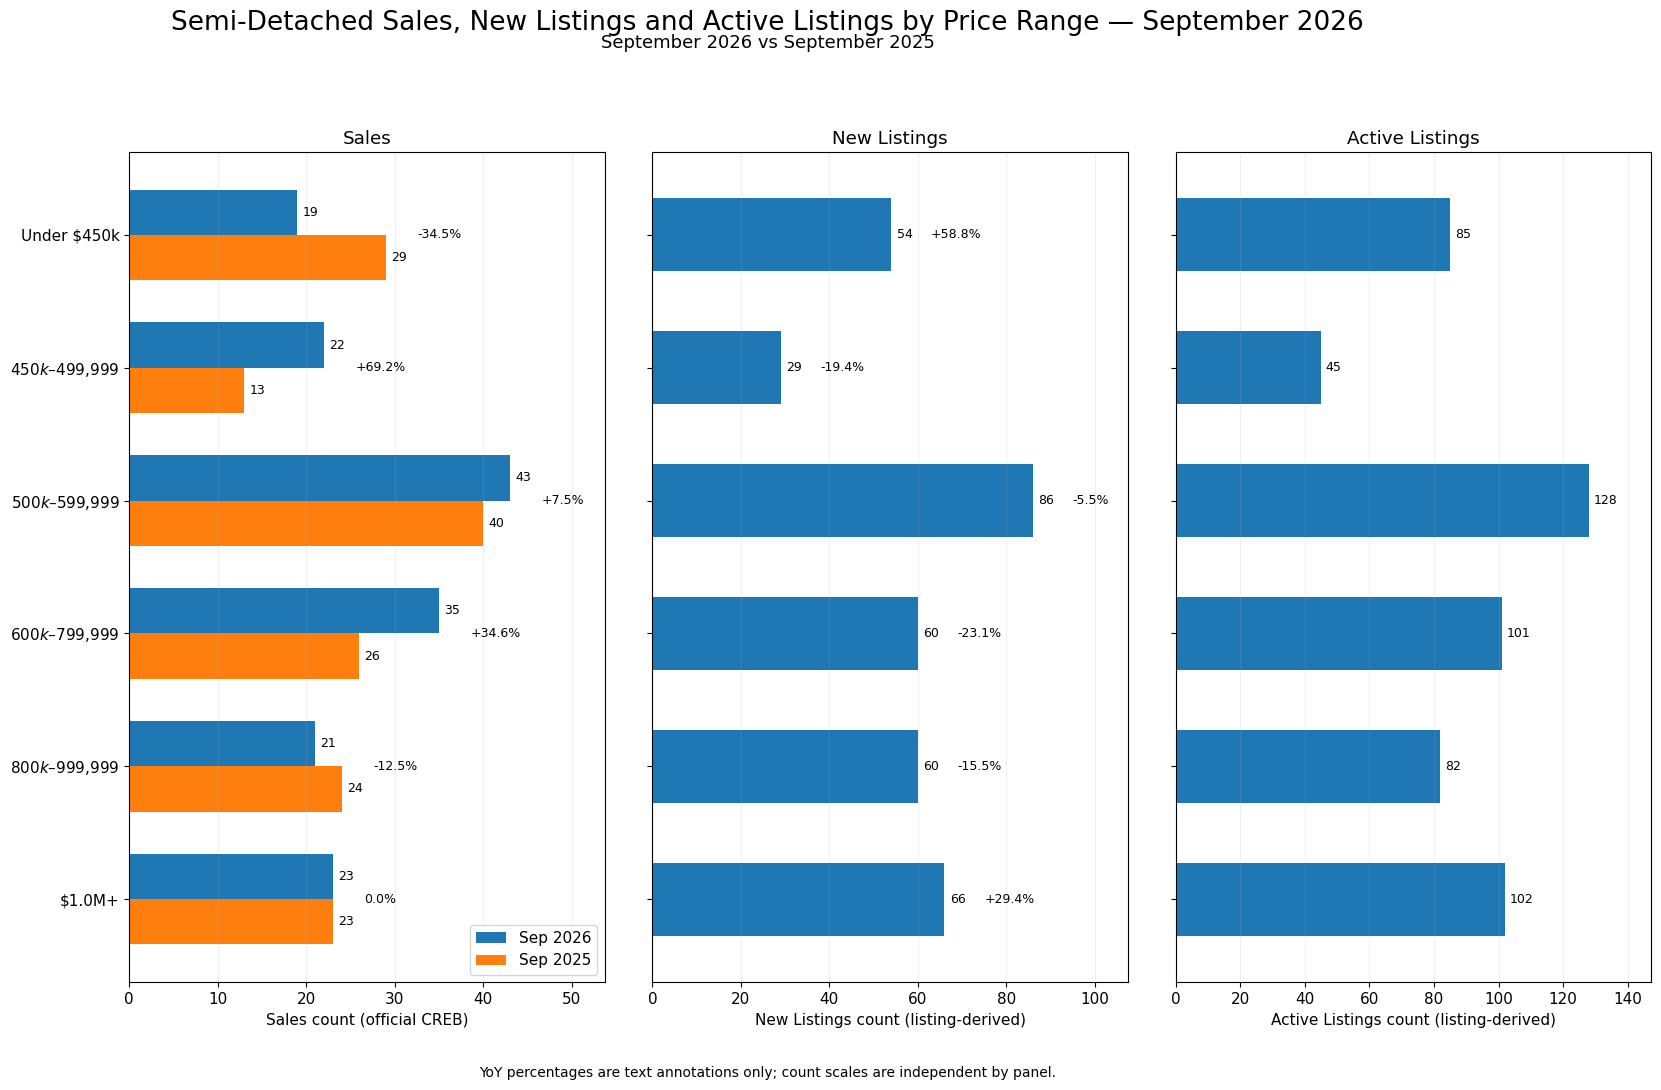
September’s price-range evidence does not show one uniform Semi-Detached market. Official CREB sales increased most strongly from $450,000-$499,999, rising from 13 to 22, or 69.2% year over year. Sales from $600,000-$799,999 also increased materially, from 26 to 35, while the $500,000-$599,999 range rose from 40 to 43. Those gains contrast with the lower end, where sales under $450,000 fell from 29 to 19, and with $800,000-$999,999, where sales declined from 24 to 21. Sales at $1,000,000+ were unchanged at 23.
Listing-derived new-listing flow adds an important counterpoint. Under $450,000, new listings increased from 34 to 54, up 58.8%, even as official sales declined. The $1,000,000+ range also received more new listings, rising from 51 to 66, or 29.4%, while sales were flat. In contrast, new listings declined 19.4% from $450,000-$499,999 and 23.1% from $600,000-$799,999, the two ranges with the largest sales gains. The $500,000-$599,999 and $800,000-$999,999 ranges also recorded fewer new listings than a year earlier.
Current Active Listings were concentrated in several different price bands. The largest Active count was 128 from $500,000-$599,999, followed by 102 at $1,000,000+ and 101 from $600,000-$799,999. Under $450,000 had 85 Active Listings, while $450,000-$499,999 had only 45. These are current Active-only listing-level counts and are not the official CREB Inventory measure.
The combined pattern matters more than any single count. The $450,000-$499,999 range paired a large sales increase with lower new-listing flow and the smallest Active count, while the under-$450,000 range paired weaker sales with substantially more new listings. The million-dollar-plus range had flat sales but a larger inflow of new listings and more than 100 Active properties. Those contrasts show why the city-wide Balanced Market label needs to be narrowed to the relevant price range before judging current competition and choice.
| Price Range | Sales | Sales YoY | New Listings | New Listings YoY | Active Listings |
|---|---|---|---|---|---|
| Under $450,000 | 19 | -34.5% | 54 | +58.8% | 85 |
| $450,000-$499,999 | 22 | +69.2% | 29 | -19.4% | 45 |
| $500,000-$599,999 | 43 | +7.5% | 86 | -5.5% | 128 |
| $600,000-$799,999 | 35 | +34.6% | 60 | -23.1% | 101 |
| $800,000-$999,999 | 21 | -12.5% | 60 | -15.5% | 82 |
| $1,000,000+ | 23 | 0.0% | 66 | +29.4% | 102 |
Sales and Sales YoY are official CREB® measures. New Listings, New Listings YoY and Active Listings are derived from Pillar 9™ MLS® records. Active Listings is an Active-only listing-level count and is not official CREB Inventory.
Geographic Differences
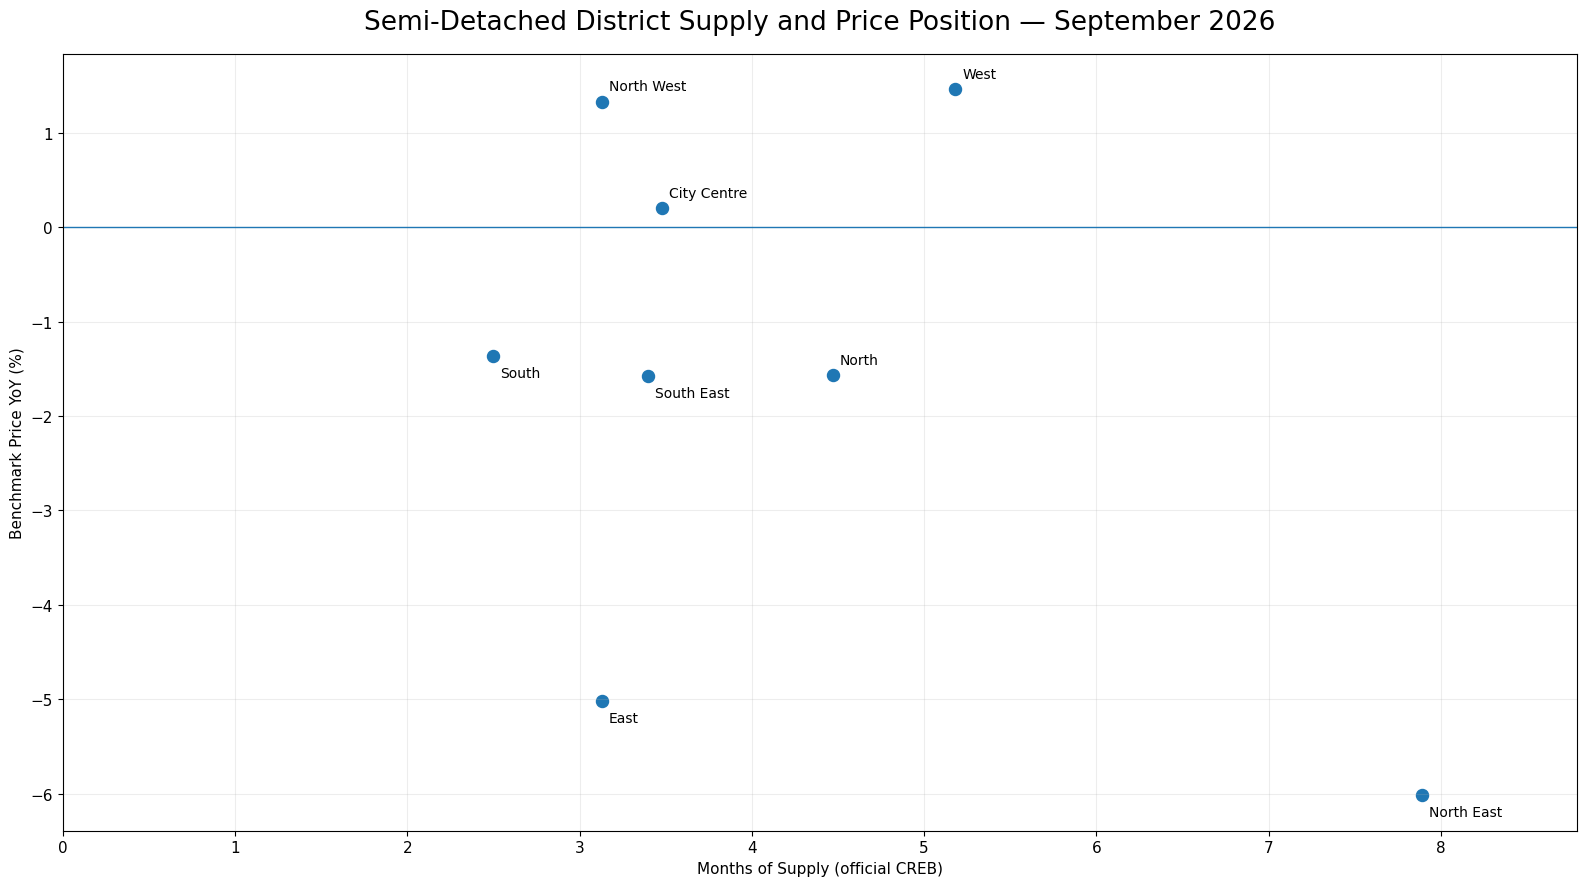
Semi-Detached supply conditions also varied substantially across Calgary in September. North East had the highest official Months of Supply at 7.89, followed by West at 5.18 and North at 4.47. The remaining five districts ranged from 2.50 in South to 3.48 in City Centre. Those differences sit behind the city-wide 3.67 reading and show that the amount of inventory relative to monthly sales was far from uniform.
Benchmark-price movement was equally mixed. West recorded the strongest annual increase at +1.46%, followed by North West at +1.33% and City Centre at +0.20%. North East, despite its higher supply reading, had the largest annual decline at -6.02%; East was down 5.02%. South, South East and North were also negative.
The relationship is not mechanical. West combined 5.18 months of supply with a positive annual benchmark comparison, while South had the lowest supply reading at 2.50 and a benchmark price 1.37% below a year earlier. North West and East both stood at 3.13 months of supply but had very different annual price results. District evidence is therefore most useful as a paired view of current supply and price movement, not as a basis for claiming that one measure directly caused the other.
| District | Sales | Inventory | Months of Supply | Benchmark Price | Benchmark Price YoY |
|---|---|---|---|---|---|
| City Centre | 48 | 167 | 3.48 | $957,500 | +0.20% |
| North East | 9 | 71 | 7.89 | $416,500 | -6.02% |
| North | 17 | 76 | 4.47 | $484,100 | -1.57% |
| North West | 16 | 50 | 3.13 | $680,000 | +1.33% |
| West | 11 | 57 | 5.18 | $826,000 | +1.46% |
| South | 32 | 80 | 2.50 | $524,400 | -1.37% |
| South East | 20 | 68 | 3.40 | $506,100 | -1.58% |
| East | 8 | 25 | 3.13 | $368,600 | -5.02% |
Source: CREB® City of Calgary Monthly Statistics, September 2026.
What Is Driving the Semi-Detached Market
September’s city-wide balance reflects several offsetting internal forces. Compared with a year earlier, Semi-Detached sales were modestly higher and official inventory was lower. That combination reduced Months of Supply from 3.99 to 3.67 and kept the overall market inside the governed Balanced range. At the same time, the most recent monthly sequence moved differently: sales eased after the June high, September new listings rebounded, and inventory rose from its August level. The annual and recent directions therefore point to different parts of the same balance.
Price-range results help explain why the aggregate remains stable despite visible movement underneath it. Sales strength from $450,000 through $799,999 was offset by weaker activity under $450,000 and from $800,000-$999,999, with million-dollar-plus sales flat. Listing flows also moved against sales in several ranges: the lower end and $1,000,000+ received more new listings, while some ranges with stronger sales received fewer. This redistributes current choice without producing one uniform segment pattern.
Geography creates a similar offset. District supply readings ranged from 2.50 to 7.89 months, while annual benchmark changes ranged from +1.46% to -6.02%. When divergent price ranges and districts are aggregated, the subtype-wide result can remain balanced and the benchmark can appear almost unchanged even though the competitive setting differs materially within the market.
What This Means for Buyers and Sellers
For Semi-Detached buyers, the September city-wide figures provide a starting point rather than a complete description of choice. A 3.67 Months of Supply reading is balanced overall, but the price-range evidence shows very different combinations of sales and available listings. Under $450,000, official sales fell 34.5% year over year while listing-derived new listings rose 58.8%, and 85 properties were Active at the current snapshot. By contrast, $450,000-$499,999 sales rose 69.2% while new listings declined 19.4% and only 45 listings were Active. Those two adjacent ranges illustrate why a buyer’s search budget can materially change the competitive context.
The middle and upper ranges require the same segmentation. The $500,000-$599,999 range had the largest Active count at 128 while sales were modestly higher than a year ago. From $600,000-$799,999, sales were up 34.6% with 101 Active Listings and fewer new listings than last September. At $1,000,000+, sales were flat but new listings increased 29.4% and 102 properties were Active. These counts do not determine how any particular home will perform, but they indicate how much current choice sits beside the sales trend in each range.
For sellers, the nearly flat city-wide benchmark price should not be treated as evidence that pricing conditions are identical across Calgary. District benchmark changes ranged from +1.46% in West to -6.02% in North East, while official district Months of Supply varied from 2.50 to 7.89. A property’s immediate competitors and recent comparable sales therefore matter more than applying the city-wide benchmark change or market status uniformly.
The practical interpretation for both sides is to move from broad to specific evidence: use the Balanced Market classification for city-wide context, then narrow to the relevant price range, district and comparable properties. That preserves the value of the headline measures without assuming that every Semi-Detached transaction is occurring under the same competitive conditions.
What to Watch Next
First, watch whether the post-June sales slowdown stabilizes while the September inventory rebound continues. If inventory keeps rising while sales remain near current levels or fall, the supply-to-sales relationship would loosen; if sales strengthen or inventory retreats, it would tighten. That relationship is what determines whether the current Balanced position begins to shift.
Second, monitor whether the strong sales gains from $450,000-$799,999 persist and whether new-listing flow catches up. A change in that relationship would alter the current contrast between stronger sales and reduced incoming supply in those ranges.
Finally, watch district supply and benchmark movement together. Convergence between higher-supply areas such as North East and lower-supply districts would make the city-wide average more representative. Continued dispersion, especially if annual benchmark changes also remain widely separated, would reinforce the need for district-specific interpretation.
Explore the Market in More Detail
Sources and Methodology
Official CREB® City of Calgary Monthly Statistics are the authoritative source for the Semi-Detached headline measures, the 13-month Sales/New Listings/Inventory series, price-range Sales and Sales year-over-year comparisons, and district Sales, Inventory, Months of Supply, Benchmark Price and Benchmark Price year-over-year changes.
Pillar 9™ MLS® listing records are used only for the price-range New Listings counts and year-over-year comparisons, and for the current Active-only listing counts. Pending listings are excluded from Active Listings. These listing-derived Active counts are not the same measure as official CREB Inventory.
The city-wide Market Status is determined only from official Semi-Detached Months of Supply: below 2.50 is a Seller’s Market, 2.50 through 4.00 is a Balanced Market, and above 4.00 is a Buyer’s Market. Price-range and district evidence is descriptive and is not assigned separate market-status labels.