
Calgary's Semi-Detached market remained balanced in October 2026, with 3.16 months of supply and a benchmark price of $685,200. Sales increased from September but were slightly below October 2025, while inventory and new listings were lower than a year earlier. Price-range activity and district supply conditions varied considerably. This report examines those differences and what they mean for buyers and sellers.
Executive Summary
Calgary's Semi-Detached market remained balanced in October 2026, although the balance became somewhat tighter than in September. CREB recorded 184 sales, 302 new listings and 581 units of inventory, producing 3.16 months of supply. Sales rose from September's 163 while both new listings and inventory declined. The benchmark price was $685,200, unchanged from September and 0.78% above October 2025. On a year-over-year basis, sales were nearly flat, but new listings and inventory were lower.
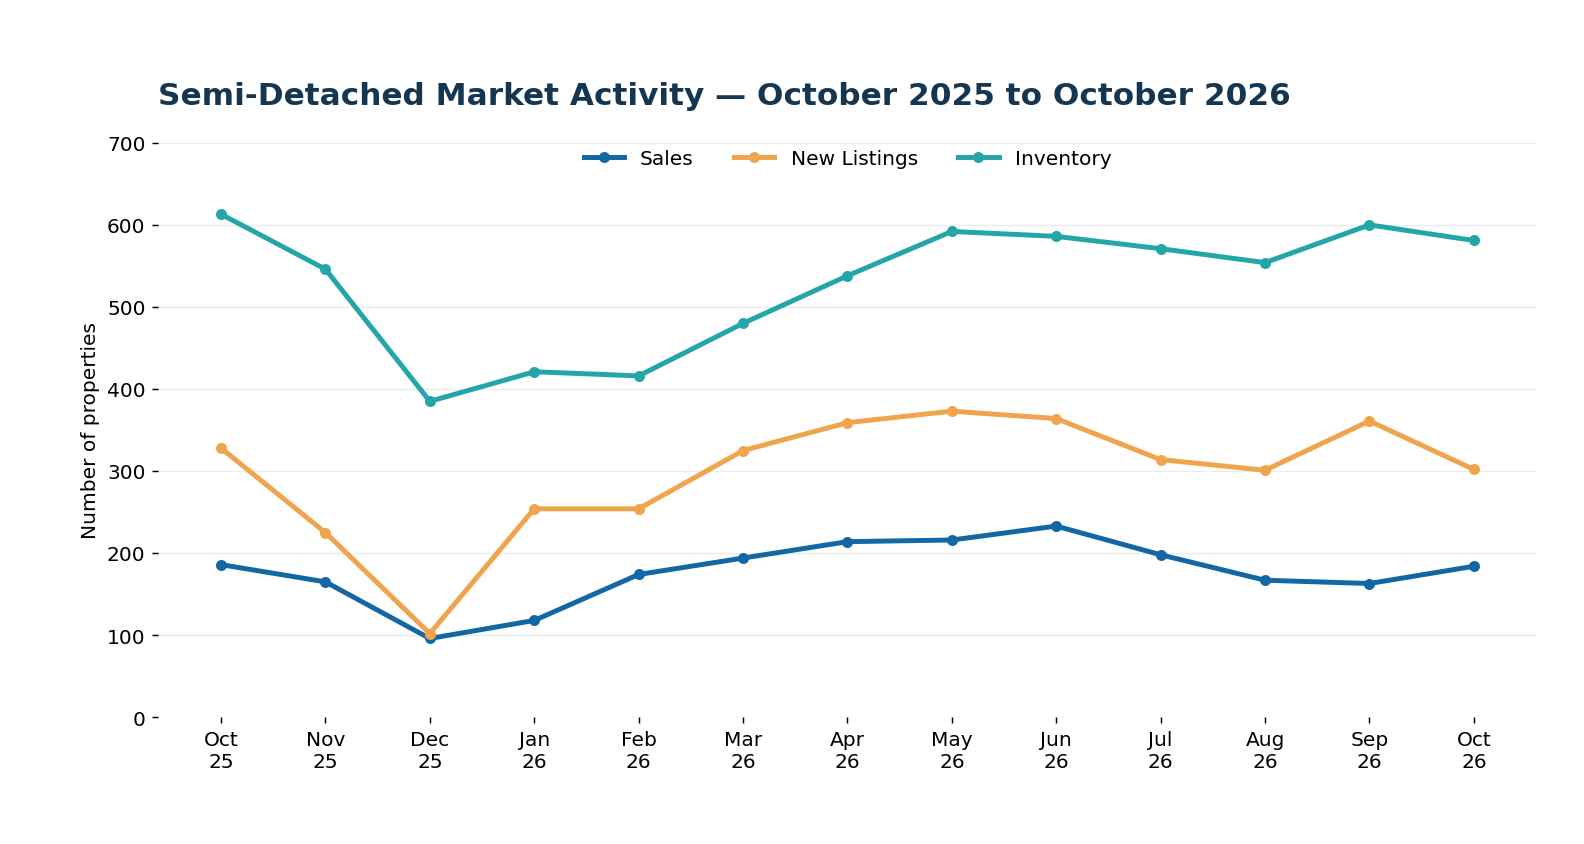
The 13-month trend shows a distinct sequence: activity weakened through the end of 2025, recovered into the first half of 2026, eased after June and then improved in October. The October sales increase did not return the market to its June peak. As a result, the latest month suggests a shift in the relationship between transactions and available supply rather than an across-the-board change in direction.
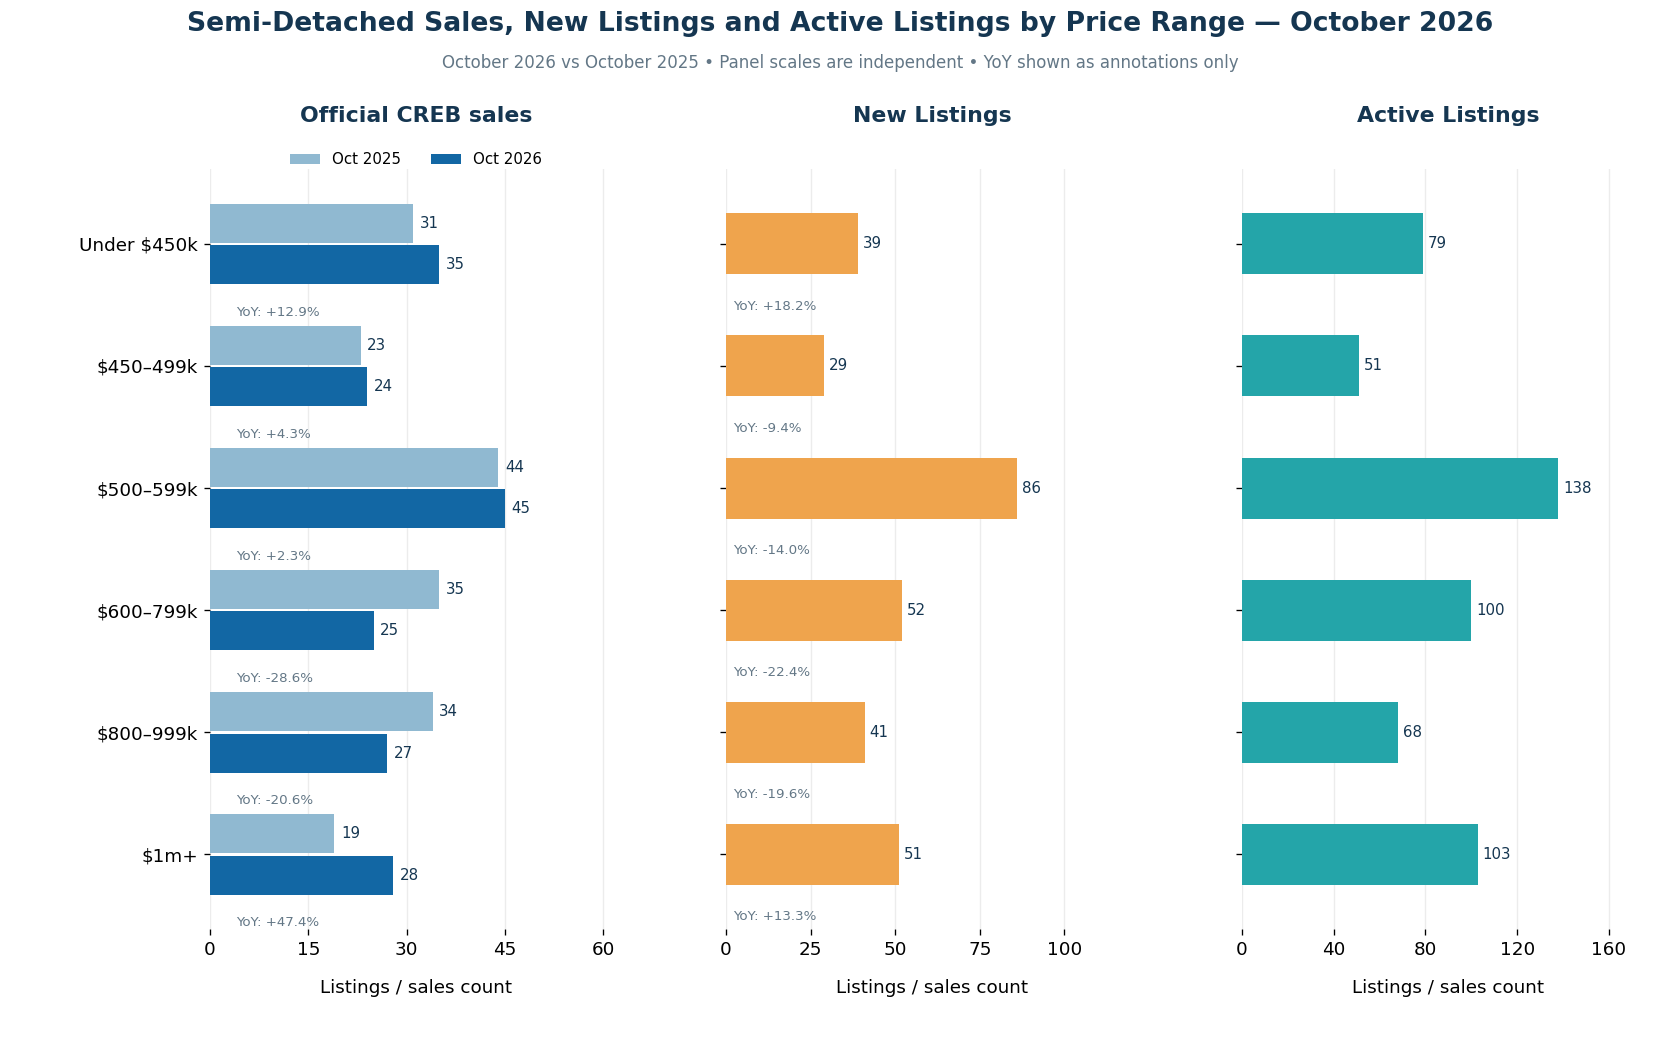
Conditions differed by price range. Official sales increased 47.4% above $1 million and 12.9% under $450,000, while the $600,000-$799,999 and $800,000-$999,999 ranges recorded annual declines. The largest current sales total and the highest Active-only listing count were both in the $500,000-$599,999 range. Those listing counts describe the supplied current Active stock, not official CREB Inventory by price range.
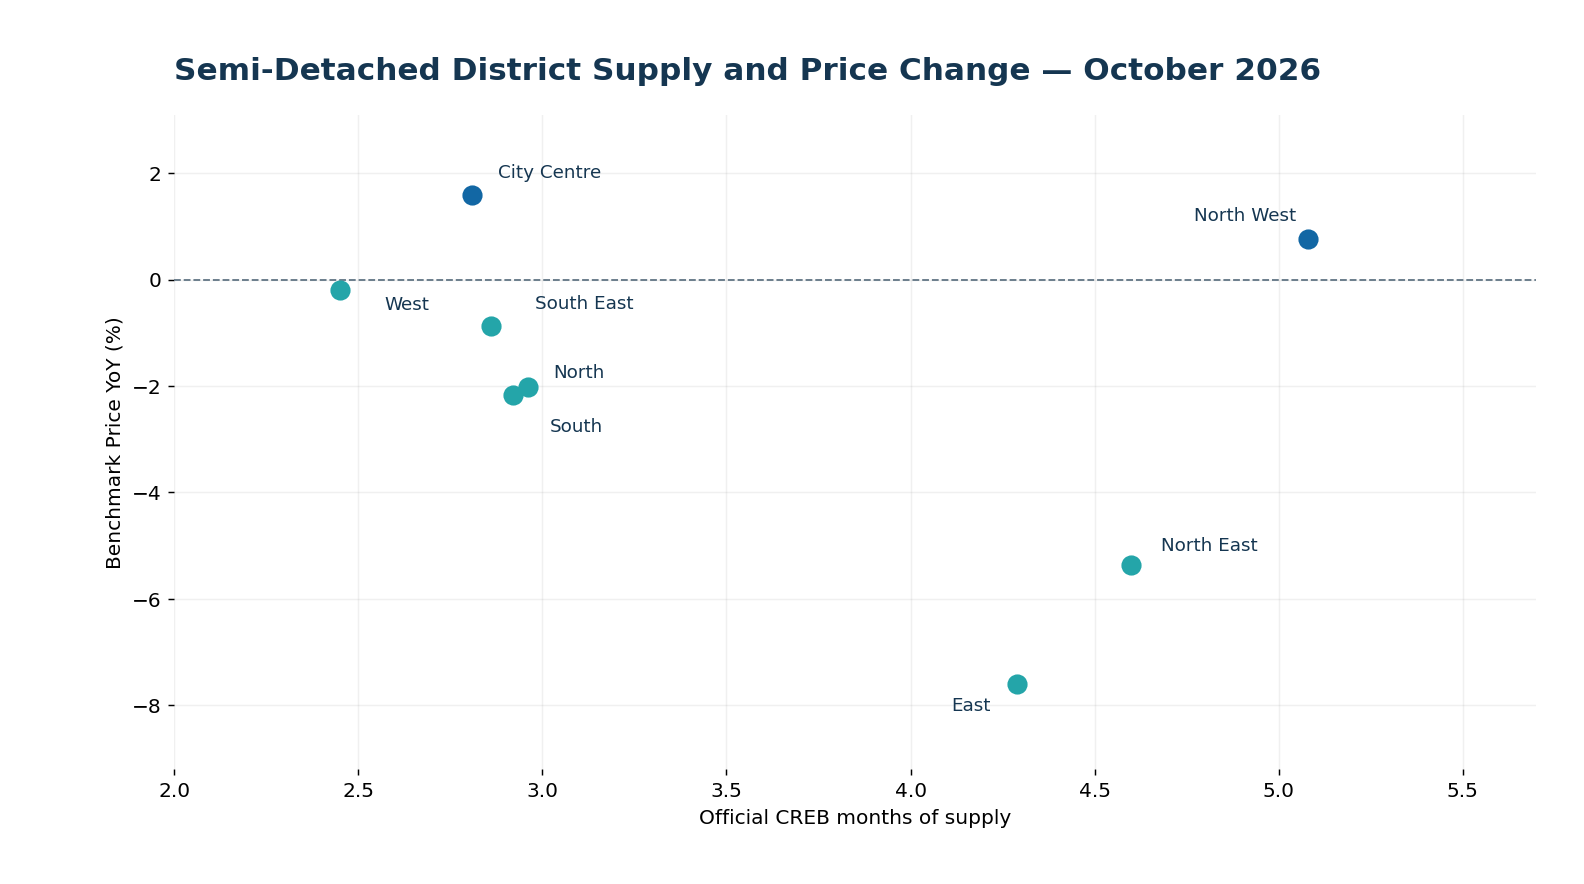
Geography was equally varied. North West had 5.08 months of supply, compared with 2.45 in West, and annual benchmark-price changes ranged from a 1.59% increase in City Centre to a 7.60% decline in East. For buyers and sellers, the balanced city-wide classification is a starting point; the relevant price range, district and comparable properties remain central to interpreting current competition.
Semi-Detached Market at a Glance
How the Semi-Detached Market Is Changing
Calgary's Semi-Detached market finished October with more sales but fewer new listings and fewer properties in official inventory than in September. CREB recorded 184 sales, up from 163 in September, while new listings fell from 361 to 302. Inventory moved from 600 to 581. These simultaneous changes reduced months of supply from approximately 3.68 in September to 3.16 in October, placing the city-wide segment within the Balanced Market range while indicating a tighter relationship between available supply and recent sales.
The 13-month path puts this change in perspective. October 2025 began with 186 sales, 328 new listings and 613 inventory units. Sales then fell to 96 in December before recovering through the first half of 2026. The monthly series reached 233 sales in June, alongside 364 new listings and 586 inventory units. Sales moderated to 198 in July, 167 in August and 163 in September, before October's improvement to 184. October's recovery therefore interrupted the late-summer decline without returning activity to the June level.
New supply followed a different course. New listings fell to 102 in December 2025, rebuilt to 373 in May 2026 and then varied between 301 and 364 from June through October. Inventory rose from 385 in December to 600 in September, a sustained rebuilding of choice from the year-end low. The October decline to 581 is meaningful within that sequence but still leaves considerably more inventory than early in 2026. It is the relationship among sales, incoming listings and standing inventory, rather than any single monthly change, that establishes the current competitive setting.
Relative to October 2025, sales were down only 1.08%, while new listings declined 7.93% and inventory declined 5.22%. Months of supply fell from 3.30 to 3.16. The October benchmark price held at $685,200 from September and stood 0.78% above its year-earlier level. Together, these measures describe a balanced market with a somewhat tighter October supply-to-sales relationship, not a uniform acceleration across every price point or district.
Where the Semi-Detached Market Is Diverging
October's Semi-Detached sales were not distributed evenly across price ranges. Official CREB sales in the $1,000,000-plus band increased from 19 in October 2025 to 28 this October, a 47.4% gain. Under $450,000, sales increased from 31 to 35, or 12.9%. By contrast, sales declined from 35 to 25 in the $600,000-$799,999 range and from 34 to 27 in the $800,000-$999,999 range. Those two mid-to-upper ranges account for much of the weakness outside the higher-priced tail, even though city-wide Semi-Detached sales changed little from a year earlier.
The $500,000-$599,999 range remained the largest current sales band at 45 transactions, almost unchanged from 44 a year earlier. The $450,000-$499,999 band also held relatively steady at 24 versus 23. These results illustrate why aggregate sales alone cannot describe demand at each budget. The 47.4% gain above $1 million is based on a smaller starting count than the largest middle bands, so its percentage movement should not be interpreted as the broadest source of transaction volume.
Listing-derived new supply adds another dimension. In October, 86 Semi-Detached listings entered the market at original asking prices of $500,000-$599,999, down 14.0% from a year earlier. New listings were also lower in the $600,000-$799,999 and $800,000-$999,999 ranges, by 22.4% and 19.6% respectively. Under $450,000, new listings rose 18.2% to 39; above $1 million, they rose 13.3% to 51. These new-listing comparisons describe the flow of newly marketed homes, not an official CREB inventory breakdown.
At the current snapshot, the supplied listings show 138 Active Semi-Detached properties at $500,000-$599,999, more than in any other range. There were 103 Active listings above $1 million, 100 at $600,000-$799,999 and 79 under $450,000. The six band totals describe Active-only listing choices, with Pending excluded. They do not establish price-range months of supply or market-status labels, and they are not interchangeable with CREB's official city-wide Inventory measure.
| Price Range | Sales | Sales YoY | New Listings | New Listings YoY | Active Listings |
|---|---|---|---|---|---|
| Under $450,000 | 35 | +12.9% | 39 | +18.2% | 79 |
| $450,000-$499,999 | 24 | +4.3% | 29 | -9.4% | 51 |
| $500,000-$599,999 | 45 | +2.3% | 86 | -14.0% | 138 |
| $600,000-$799,999 | 25 | -28.6% | 52 | -22.4% | 100 |
| $800,000-$999,999 | 27 | -20.6% | 41 | -19.6% | 68 |
| $1,000,000+ | 28 | +47.4% | 51 | +13.3% | 103 |
Sales and Sales YoY are official CREB® measures. New Listings, New Listings YoY and Active Listings are derived from Pillar 9™ MLS® records. Active Listings is an Active-only listing-level count and is not official CREB Inventory.
Geographic Differences
District supply conditions differed sharply in October, despite the city-wide Semi-Detached months-of-supply figure of 3.16. North West had the highest official district reading, at 5.08 months, followed by North East at 4.60 and East at 4.29. West had the lowest at 2.45, with City Centre at 2.81 and South East at 2.86. The range between West and North West shows that buyers comparing different parts of Calgary could encounter substantially different levels of available supply relative to current sales.
Annual benchmark-price changes did not move uniformly with those supply readings. City Centre increased 1.59% year over year, while North West rose 0.77% despite its relatively high 5.08 months of supply. West's benchmark was down just 0.20%, even though its supply reading was the lowest. North East fell 5.36%, and East registered the largest decline at 7.60%. These figures are independent observations; they do not establish that one month's supply position caused a particular annual price change.
District transaction volumes also varied. City Centre recorded 52 sales, compared with seven in East and 12 in North West. Higher or lower months of supply should therefore be read alongside the size and composition of each district's market. The district table provides the official comparison; the city-wide total remains CREB's authoritative aggregate, including any activity not assigned to the eight district rows.
| District | Sales | Inventory | Months of Supply | Benchmark Price | Benchmark Price YoY |
|---|---|---|---|---|---|
| City Centre | 52 | 146 | 2.81 | $961,000 | +1.59% |
| North East | 15 | 69 | 4.60 | $415,100 | -5.36% |
| North | 27 | 80 | 2.96 | $480,700 | -2.02% |
| North West | 12 | 61 | 5.08 | $676,200 | +0.77% |
| West | 22 | 54 | 2.45 | $812,600 | -0.20% |
| South | 26 | 76 | 2.92 | $519,100 | -2.17% |
| South East | 22 | 63 | 2.86 | $503,400 | -0.87% |
| East | 7 | 30 | 4.29 | $361,000 | -7.60% |
Source: CREB® City of Calgary Monthly Statistics, October 2026.
What Is Driving the Semi-Detached Market
The main internal development in October was a shift in the supply-to-sales relationship. Sales recovered from September while new listings and official inventory declined. That combination narrowed months of supply from the previous month, even though October sales remained slightly below their year-earlier count. It is possible for a balanced overall classification to persist while the degree of competition within that range changes, and October illustrates that distinction.
Price-range differences help explain why the aggregate is not a complete description of the market. The $500,000-$599,999 range supplied the largest number of official sales and the largest Active-only listing count in the dataset. Above $1 million, the annual increase in sales coincided with more new listings, whereas the $600,000-$999,999 ranges had fewer sales and fewer new listings than a year earlier. These contrasting patterns can offset each other in the subtype-wide totals; none can be reduced to one uniform statement about buyer competition.
Geography adds a second layer. West and City Centre had relatively low official months of supply, while North West and North East carried substantially more. Benchmark-price movement was also mixed, including modest gains in City Centre and North West alongside declines in North East and East. Because a district aggregates homes of different ages, sizes and price levels, its figures are useful as context rather than as a substitute for comparable-property analysis.
These are explanations of relationships within the observed housing-market data, not claims about interest rates, population changes or other external forces. The evidence supports a more selective reading: October's city-wide balance reflects both a tighter recent supply-to-sales ratio and divergent conditions across price ranges and locations.
What This Means for Buyers and Sellers
For buyers, October's 3.16 months of supply indicates a balanced city-wide Semi-Detached market, but it does not mean selection or negotiating conditions are identical in every search. Inventory declined from September while sales improved, which can make the available pool feel different from the previous month. A buyer focused on West or City Centre would be considering districts with lower official months of supply than someone searching North West or North East. Those district indicators are useful context, not guarantees about a specific listing.
Price-range evidence points to a similar distinction. The $500,000-$599,999 band had the highest current sales count and the most Active listings in the supplied snapshot. The $600,000-$999,999 bands recorded lower annual sales, but their new listings also declined. Fewer transactions do not necessarily mean every property faces the same level of competition. Comparing the condition, location, asking price and recent comparable sales of individual homes remains important when moving from market statistics to a purchase decision.
For sellers, the October benchmark price was 0.78% higher than a year earlier and unchanged from September. That city-wide movement should not be treated as an expected sale-price change for an individual Semi-Detached home. City Centre and North West benchmark prices moved modestly higher year over year, while North East and East fell. Within the governed price ranges, stronger annual sales above $1 million contrasted with weaker sales from $600,000 to $999,999. The relevant competitive set therefore depends on both property characteristics and the buyers likely to compare the listing with nearby alternatives.
The practical implication on both sides is to use the market report to identify where further comparison is needed. Official CREB district and subtype measures establish broad conditions; the listing-derived Active and New Listing counts add more detail by asking-price band. Neither replaces a current review of genuinely comparable homes or indicates the terms on which a specific property will sell.
What to Watch Next
The first relationship to monitor is whether October's improvement in sales continues while official inventory remains below September's level. If sales hold up as inventory stays steady or declines, months of supply could tighten further within the overall market. If sales weaken or inventory builds again, the supply-to-sales ratio could move in the opposite direction. Either outcome would matter more than an isolated monthly count.
Second, watch whether the differing annual sales patterns by price range persist. A continuation of stronger transactions above $1 million alongside weaker activity in the $600,000-$999,999 bands would reinforce the need for segmented analysis. Changes in New Listings and Active-only counts can help show whether available choices are expanding or contracting within those same asking-price ranges.
Finally, compare district months of supply with subsequent benchmark-price movements, particularly where current supply and annual price direction do not align neatly. Those comparisons can signal evolving local conditions, but they should be evaluated over multiple months without assuming that a single supply reading predicts the next price change.
Explore the Market in More Detail
Sources and Methodology
Official CREB® City of Calgary Monthly Statistics are the authoritative source for the Semi-Detached headline measures, the 13-month Sales/New Listings/Inventory series, price-range Sales and Sales year-over-year comparisons, and district Sales, Inventory, Months of Supply, Benchmark Price and Benchmark Price year-over-year changes.
Pillar 9™ MLS® listing records are used only for the price-range New Listings counts and year-over-year comparisons, and for current Active-only listing counts. Pending listings are excluded. These listing-derived Active counts are not the same measure as official CREB Inventory.
The city-wide Market Status is determined only from official Semi-Detached Months of Supply: below 2.50 is a Seller’s Market, 2.50 through 4.00 is a Balanced Market, and above 4.00 is a Buyer’s Market. Price-range and district evidence is descriptive and is not assigned separate market-status labels.