Eagle Ridge Apartment Homes Market Update – December 31, 2025
Market Highlights (as of December 31, 2025)
-
Average Sold Price: Over the past 12 months, apartment-style homes in Eagle Ridge have achieved an average sold price of about $1,400,000.
-
Average Days on Market: The average time on market over the period was around 95 days, which reflects a more drawn-out time on market, with some homes needing extra exposure before they sell.
-
Odds of Selling: Combining completed sales and current pendings, the likelihood of a listing selling for a apartment listing in Eagle Ridge over this window comes in at roughly 25%, based on 1 sold, 0 pending, and 3 that did not sell.
-
Monthly Selling Rate: A total of 1 sales over the past year translates into a monthly selling rate of roughly 0.1 apartment sales per month in Eagle Ridge.
-
Months of Inventory: With 0 active listings at the time of this snapshot and the current selling rate, months of inventory sits near 0 months, indicating that supply feels lean, so serious buyers often focus closely when the right home appears.
Time to Sell
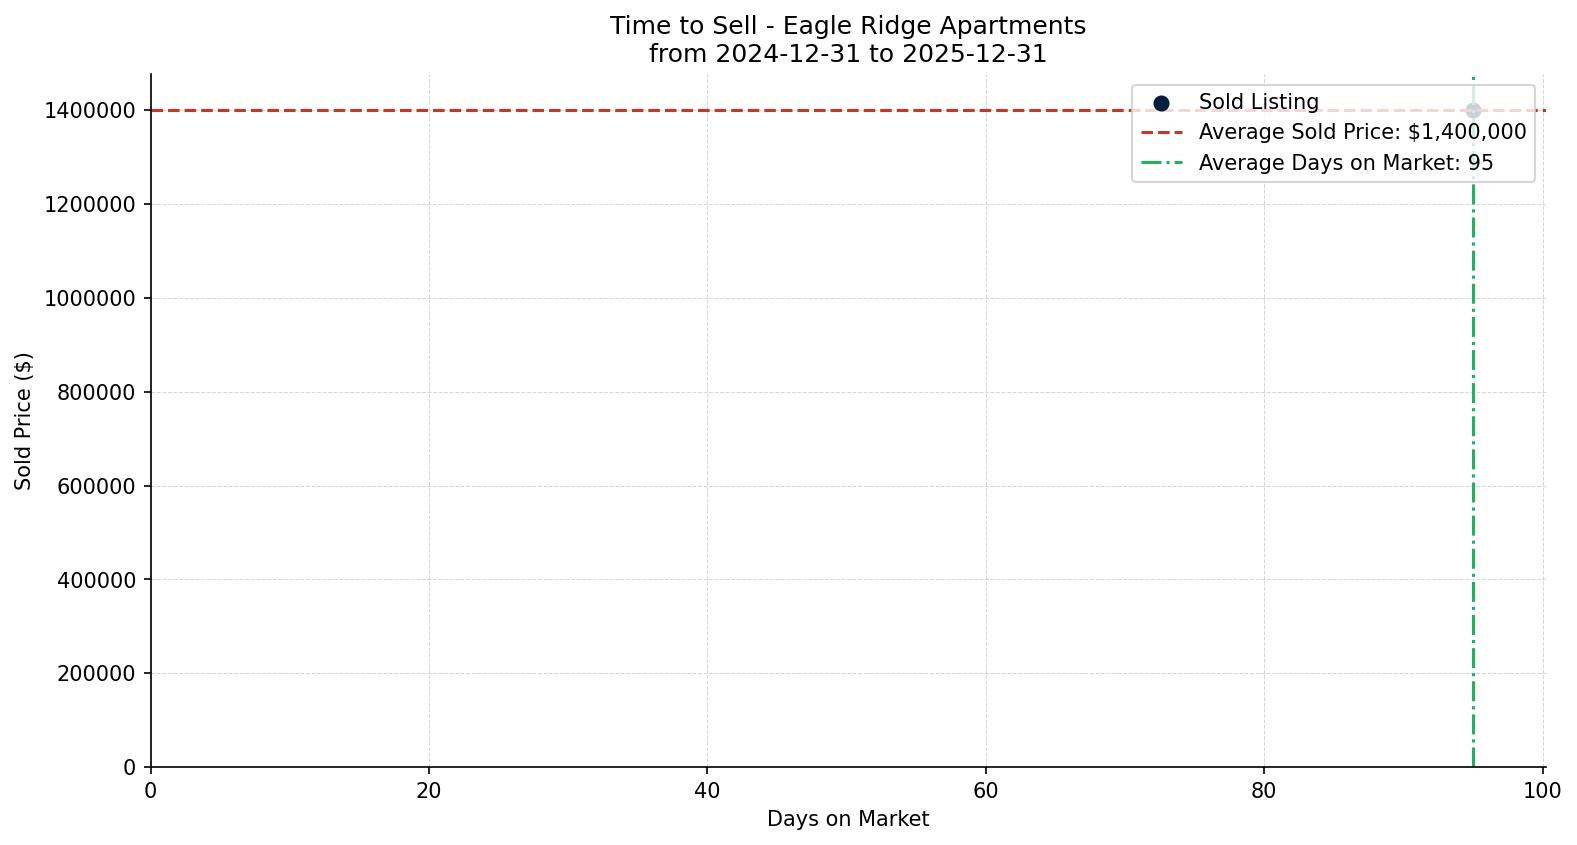
The Time to Sell chart plots individual apartment sales in Eagle Ridge by days on market and sold price over the past 12 months, from 2024-12-31 to 2025-12-31. Each point represents one sold listing, with days on market on the horizontal axis and sold price on the vertical axis, plus reference lines showing the average sold price and a typical time on market for this segment.
-
Looking at the past year, apartment homes in this area have usually taken around 95 days to reach a firm sale. That’s a useful timeline to keep in mind when you’re planning your own move.
-
Sales that completed in less than about 95 days sit on the faster side of the chart and often reflect well-prepared listings that were aligned with recent pricing, while sales that took longer than roughly 95 days illustrate cases where extra time was needed before the right buyer and price match came together.
-
Across this period, the average sold price for apartment homes in Eagle Ridge has been near $1,400,000, and points that sit well to the right of the typical days-on-market line highlight situations where pricing, condition, or more specialized features required additional exposure before a firm sale.
Odds of Selling
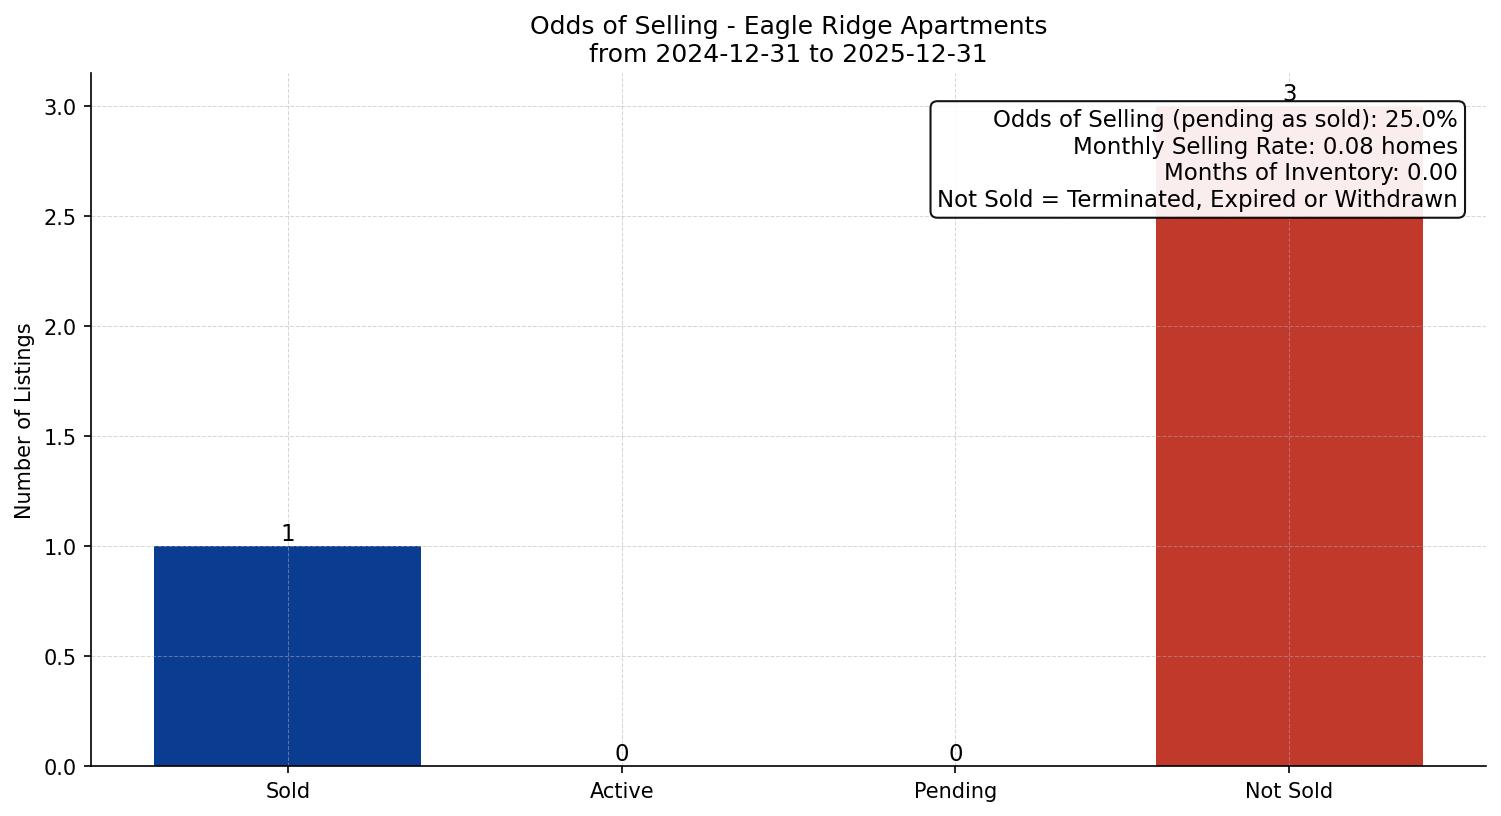
The Odds of Selling chart summarizes how many apartment listings in Eagle Ridge have sold, how many are still on the market, and how many were removed without a completed sale over the past 12 months, from 2024-12-31 to 2025-12-31. It also rolls those counts into an overall estimate of the percentage of listings that ultimately reach a firm sale.
-
Odds of Selling: Looking across these 12 months, 1 apartment listings in Eagle Ridge have successfully sold and 0 are part-way there, with 0 still on the market and 3 leaving the market unsold. Put simply, roughly 25% of listings have been making it all the way to a firm deal.
-
Monthly Selling Rate: When you smooth the results across the past 12 months, it comes to around 0.1 completed apartment sales per month, highlighting the underlying pace of demand in this segment.
-
With around 0 months of inventory derived from 0 active listings and the recent selling rate, supply feels lean, so serious buyers often focus closely when the right home appears
-
In this context, “not sold” captures listings that were terminated, expired, or withdrawn without reaching a firm sale, which helps distinguish between properties that successfully completed the moving process and those that left the market for other reasons.
Buying Pattern
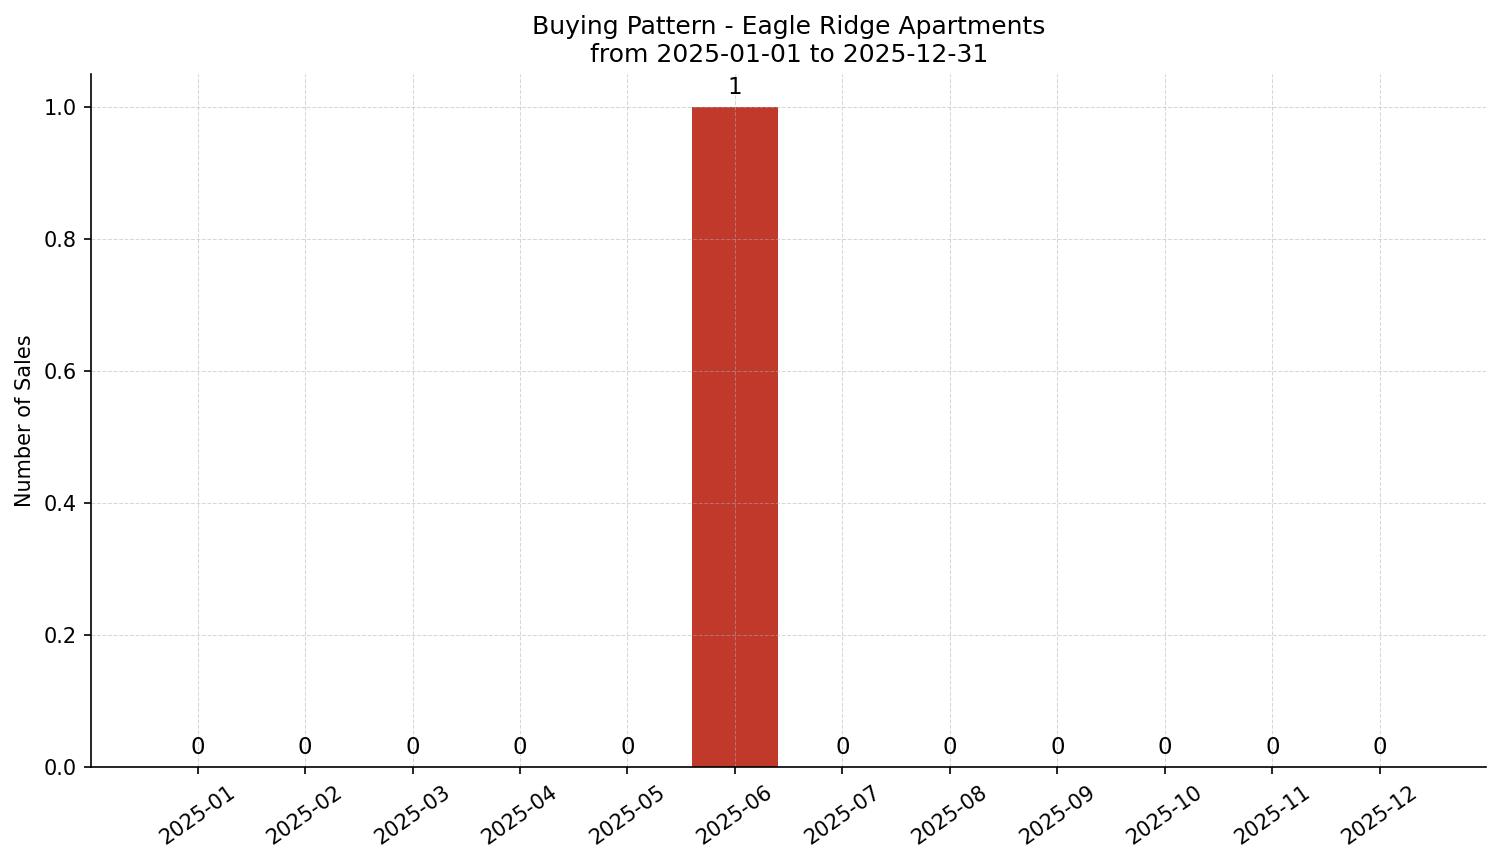
The Buying Pattern chart shows how many apartment sales in Eagle Ridge were completed in each of the last 12 months, including 11 full months plus the current month-to-date, so you can see how activity has moved through the year between 2024-12-31 and 2025-12-31.
-
The busiest months for closed apartment sales over this period were Jun 2025, where the bar heights sit at the top of the chart for this 12-month window.
-
On the quieter side, months such as Jan 2025, Feb 2025, and Mar 2025 sit closer to the bottom of the chart, illustrating periods where fewer apartment sales were recorded.
-
Across the 12-month window, monthly closed sales ranged from about 0 to 1 deals, for a total of 1 completed sales. That lines up with the monthly selling rate of roughly 0.1 sales per month shown in the broader odds-of-selling view.
Price vs. Square Footage
The Price vs. Square Footage chart focuses on the last three months of apartment sales in Eagle Ridge, plotting each sale by interior size on the horizontal axis and sold price on the vertical axis. A trend line is overlaid to summarize how sale prices have tended to move as square footage changes in this recent sample.
-
Recent closed apartment sales in this view span from around - sq. ft. through to roughly - sq. ft., and within that range the trend line suggests a softer relationship where the recent sales sample shows only a limited directional pattern between size and price.
-
Most recent apartment sales here have clustered in the core size range that many local buyers favour. That cluster helps show how extra space has been priced in real offers, rather than just on paper. The picture is based on roughly 0 sales from the last three months.
-
Taken together with the average sold price of roughly $1,400,000 over the full 12-month window, the chart can be used as a directional guide: you can locate a home's square footage on the horizontal axis, follow it up toward the trend line, and get a sense of where similar recent sales have been concentrating on the price scale.
Key Takeaways
-
Market tilt: With roughly 0 months of inventory, the apartment market in Eagle Ridge has been leaning toward seller-leaning conditions. That backdrop influences how quickly strong listings move and how firmly buyers can push on price.
-
Time to sell: Over the past 12 months, apartment listings in Eagle Ridge have taken around 95 days on average to firm up, which means the selling process has often required a longer marketing window before firming up; for planning purposes it is wise to allow for some variability around that figure.
-
Size and pricing: Even without a large sample of recent sales by square footage, the Price vs. Square Footage chart is a useful directional tool when viewed alongside individual comparables that match closely on size and key features.
Other Property Types in Eagle Ridge
Want to see the market trend for other property types in Eagle Ridge?
Considering a Move?
Whether you're considering a move within Eagle Ridge or wanting a clearer read on today’s apartment conditions, I’m here to help you make smart, confident decisions.
Buying: I’ll help you identify the strongest listings, understand real value, and avoid overpaying — especially in fast-moving pockets of Eagle Ridge.
Selling: I’ll help you price precisely for the current trend, prepare strategically, and position your apartment to stand out against active competition in Eagle Ridge.
Want a data-backed plan tailored to your next move?
Let’s talk.