Huxley Detached Homes Market Update – July 31, 2026
Market Highlights (as of July 31, 2026)
-
Average Sold Price: Over the past 12 months, detached homes in Huxley have achieved an average sold price of about $650,000.
-
Average Days on Market: The average selling pace over the period was around 29 days, which reflects a typical mid-range selling pace for this type of home.
-
Odds of Selling: Combining completed sales and current pendings, the odds of a successful sale for a detached listing in Huxley over this window comes in at roughly 15.4%, based on 2 sold, 0 pending, and 11 that did not sell.
-
Monthly Selling Rate: A total of 2 sales over the past year translates into a monthly selling rate of roughly 0.2 detached sales per month in Huxley.
-
Months of Inventory: With 5 active listings at the time of this snapshot and the current selling rate, months of inventory sits near 30 months, indicating that there is more selection on the market, and some listings may take longer to secure a buyer.
To see how these local trends compare to current inventory and pricing across the city, you can view all Calgary detached homes for sale.
Time to Sell
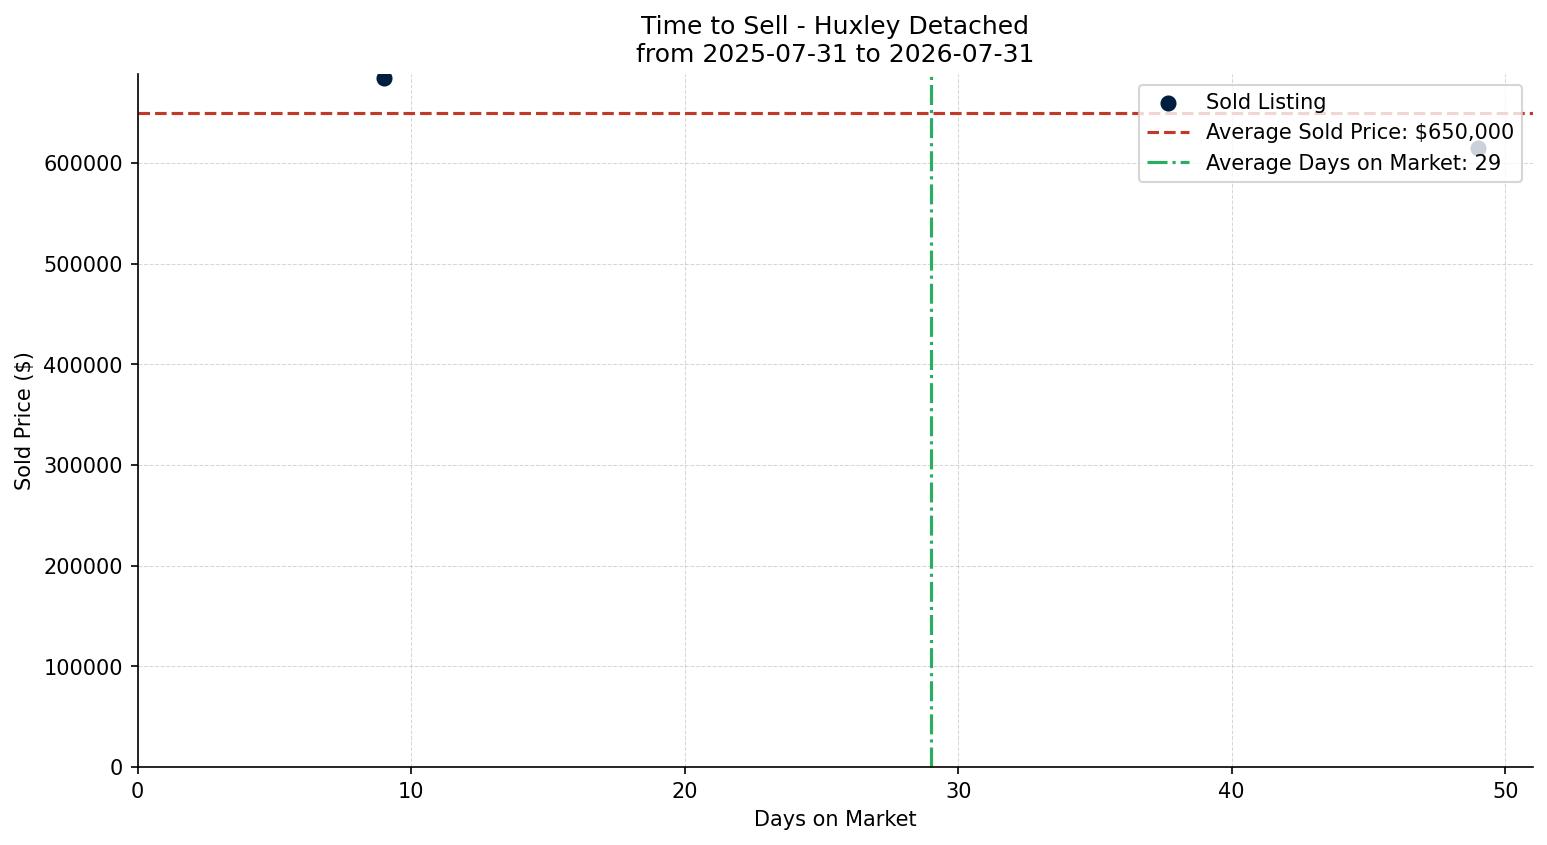
The Time to Sell chart plots individual detached sales in Huxley by days on market and sold price over the past 12 months, from 2025-07-31 to 2026-07-31. Each point represents one sold listing, with days on market on the horizontal axis and sold price on the vertical axis, plus reference lines showing the average sold price and a typical selling pace for this segment.
-
Over the past 12 months, detached listings here have taken about 29 days on average to go from listing to a firm sale. That’s a practical guide for how long a typical sale has taken in this segment.
-
Sales that completed in less than about 19 days sit on the faster side of the chart and often reflect well-prepared listings that were aligned with recent pricing, while sales that took longer than roughly 39 days illustrate cases where extra time was needed before the right buyer and price match came together.
-
Across this period, the average sold price for detached homes in Huxley has been near $650,000, and points that sit well to the right of the typical days-on-market line highlight situations where pricing, condition, or more specialized features required additional exposure before a firm sale.
Odds of Selling
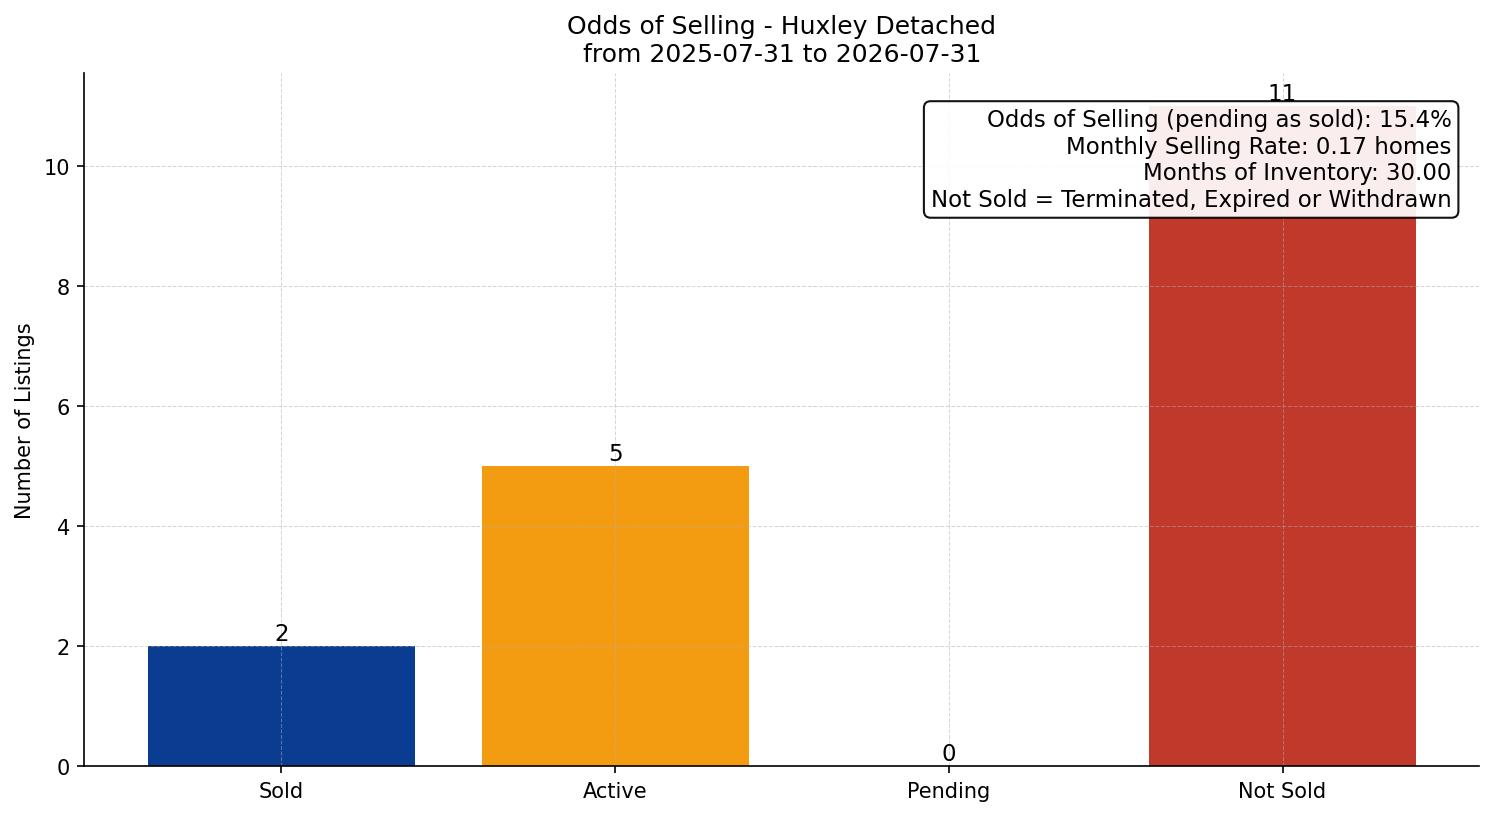
The Odds of Selling chart summarizes how many detached listings in Huxley have sold, how many are still on the market, and how many were removed without a completed sale over the past 12 months, from 2025-07-31 to 2026-07-31. It also rolls those counts into an overall estimate of the percentage of listings that ultimately reach a firm sale.
-
Odds of Selling: In the last year, the detached segment in Huxley has seen 2 completed sales and 0 pending deals, alongside 5 active listings and 11 that ended without a sale. Rolled up, that translates into about 15.4% of listings eventually reaching a firm sale.
-
Monthly Selling Rate: Spread over the year, that activity works out to roughly 0.2 detached sales per month in Huxley, a straightforward read on how much buyer demand has been in play.
-
With around 30 months of inventory derived from 5 active listings and the recent selling rate, there is more selection on the market, and some listings may take longer to secure a buyer
-
In this context, “not sold” captures listings that were terminated, expired, or withdrawn without reaching a firm sale, which helps distinguish between properties that successfully completed the moving process and those that left the market for other reasons.
Buying Pattern
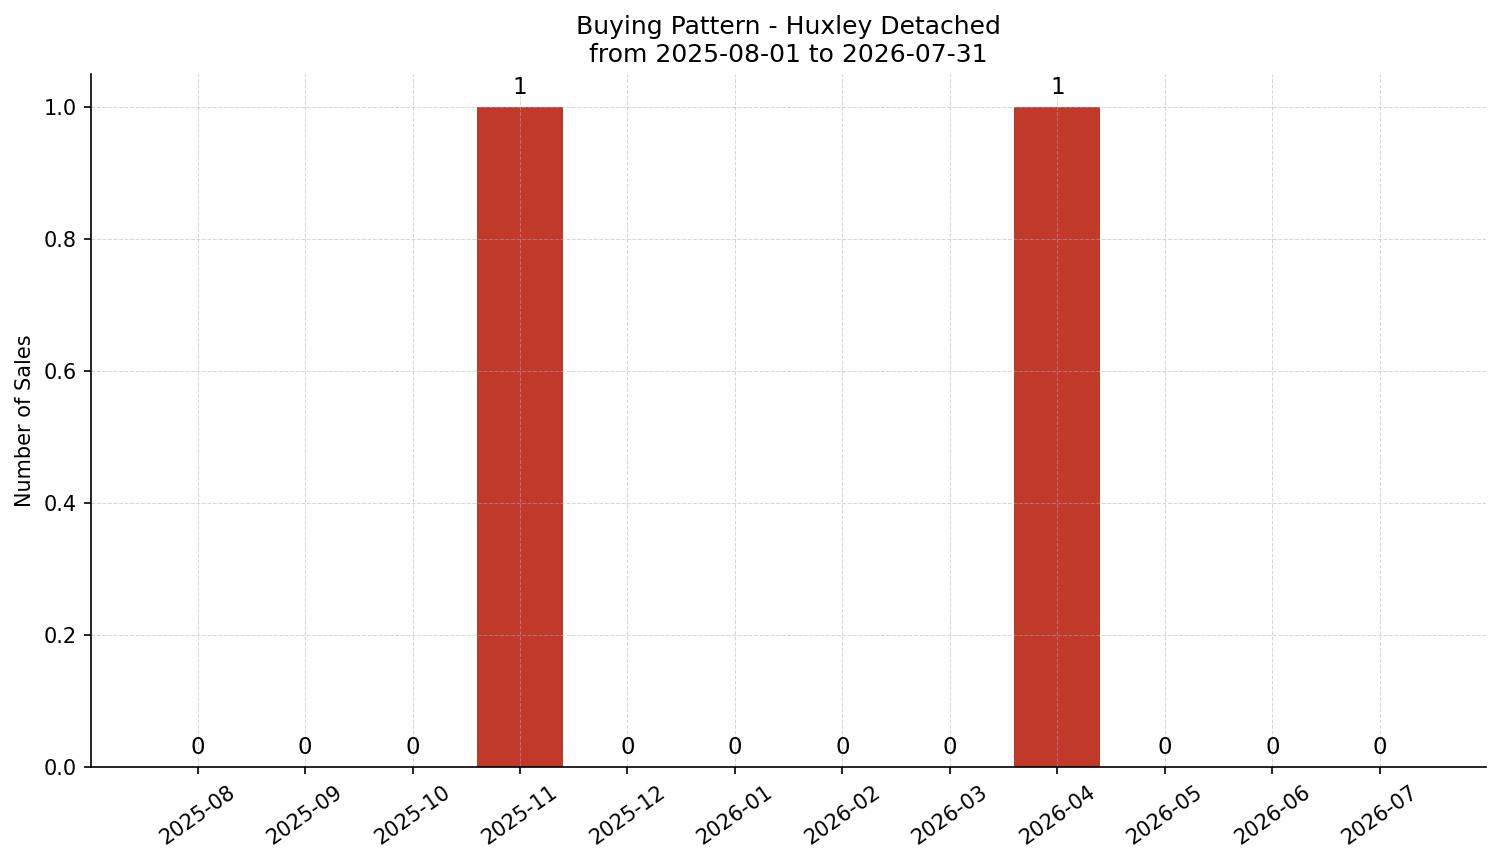
The Buying Pattern chart shows how many detached sales in Huxley were completed in each of the last 12 months, including 11 full months plus the current month-to-date, so you can see how activity has moved through the year between 2025-07-31 and 2026-07-31.
-
The busiest months for closed detached sales over this period were Nov 2025 and Apr 2026, where the bar heights sit at the top of the chart for this 12-month window.
-
On the quieter side, months such as Aug 2025, Sep 2025, and Oct 2025 sit closer to the bottom of the chart, illustrating periods where fewer detached sales were recorded.
-
Across the 12-month window, monthly closed sales ranged from about 0 to 1 deals, for a total of 2 completed sales. That lines up with the monthly selling rate of roughly 0.2 sales per month shown in the broader odds-of-selling view.
Price vs. Square Footage
The Price vs. Square Footage chart focuses on the last three months of detached sales in Huxley, plotting each sale by interior size on the horizontal axis and sold price on the vertical axis. A trend line is overlaid to summarize how sale prices have tended to move as square footage changes in this recent sample.
-
Recent closed detached sales in this view span from around - sq. ft. through to roughly - sq. ft., and within that range the trend line suggests a softer relationship where the recent sales sample shows only a limited directional pattern between size and price.
-
On this chart, most recent detached sales fall into a familiar size range for this community. That gives a practical sense of how buyers have been valuing extra square footage in everyday day-to-day trades. This view is based on about 0 sales over the most recent three-month period.
-
Taken together with the average sold price of roughly $650,000 over the full 12-month window, the chart can be used as a directional guide: you can locate a home's square footage on the horizontal axis, follow it up toward the trend line, and get a sense of where similar recent sales have been concentrating on the price scale.
Key Takeaways
-
Market tilt: With months of inventory sitting near 30 months, overall conditions in the detached segment of Huxley point toward buyer-leaning conditions. That shapes how much leverage buyers and sellers have when they negotiate around recent comparables.
-
Listing outcomes: Over the last 12 months, roughly 15.4% of detached listings in Huxley have either sold or are currently pending, while the remainder were withdrawn or expired. That makes it important to align pricing and preparation with where most successful sales have been landing on the charts.
-
Time to sell: Over the past 12 months, detached listings in Huxley have taken around 29 days on average to firm up, which means the selling process has been progressing at a mid-range pace that feels typical for this type of home; for planning purposes it is wise to allow for some variability around that figure.
Other Property Types in Huxley
Market activity in Huxley can vary significantly by property type. While detached homes show specific absorption rates, you may find different trends in the semi-detached home market, which often appeal to a different buyer demographic.
Considering a Move?
Whether you're considering a move within Huxley or wanting a clearer read on today’s detached conditions, I’m here to help you make smart, confident decisions.
Buying: I’ll help you identify the strongest listings, understand real value, and avoid overpaying — especially in fast-moving pockets of Huxley.
Selling: I’ll help you price precisely for the current trend, prepare strategically, and position your detached to stand out against active competition in Huxley.
Want a data-backed plan tailored to your next move?
Let’s talk.