
A detached home entering Calgary's market from $500,000 to under $800,000 does not necessarily face the same selling conditions in every part of the city.
I analyzed 6,282 detached Calgary properties that entered the market from September 1, 2025 through May 31, 2026 with an original asking price of at least $500,000 and under $800,000. Each property was then followed for 90 days to determine whether it sold.
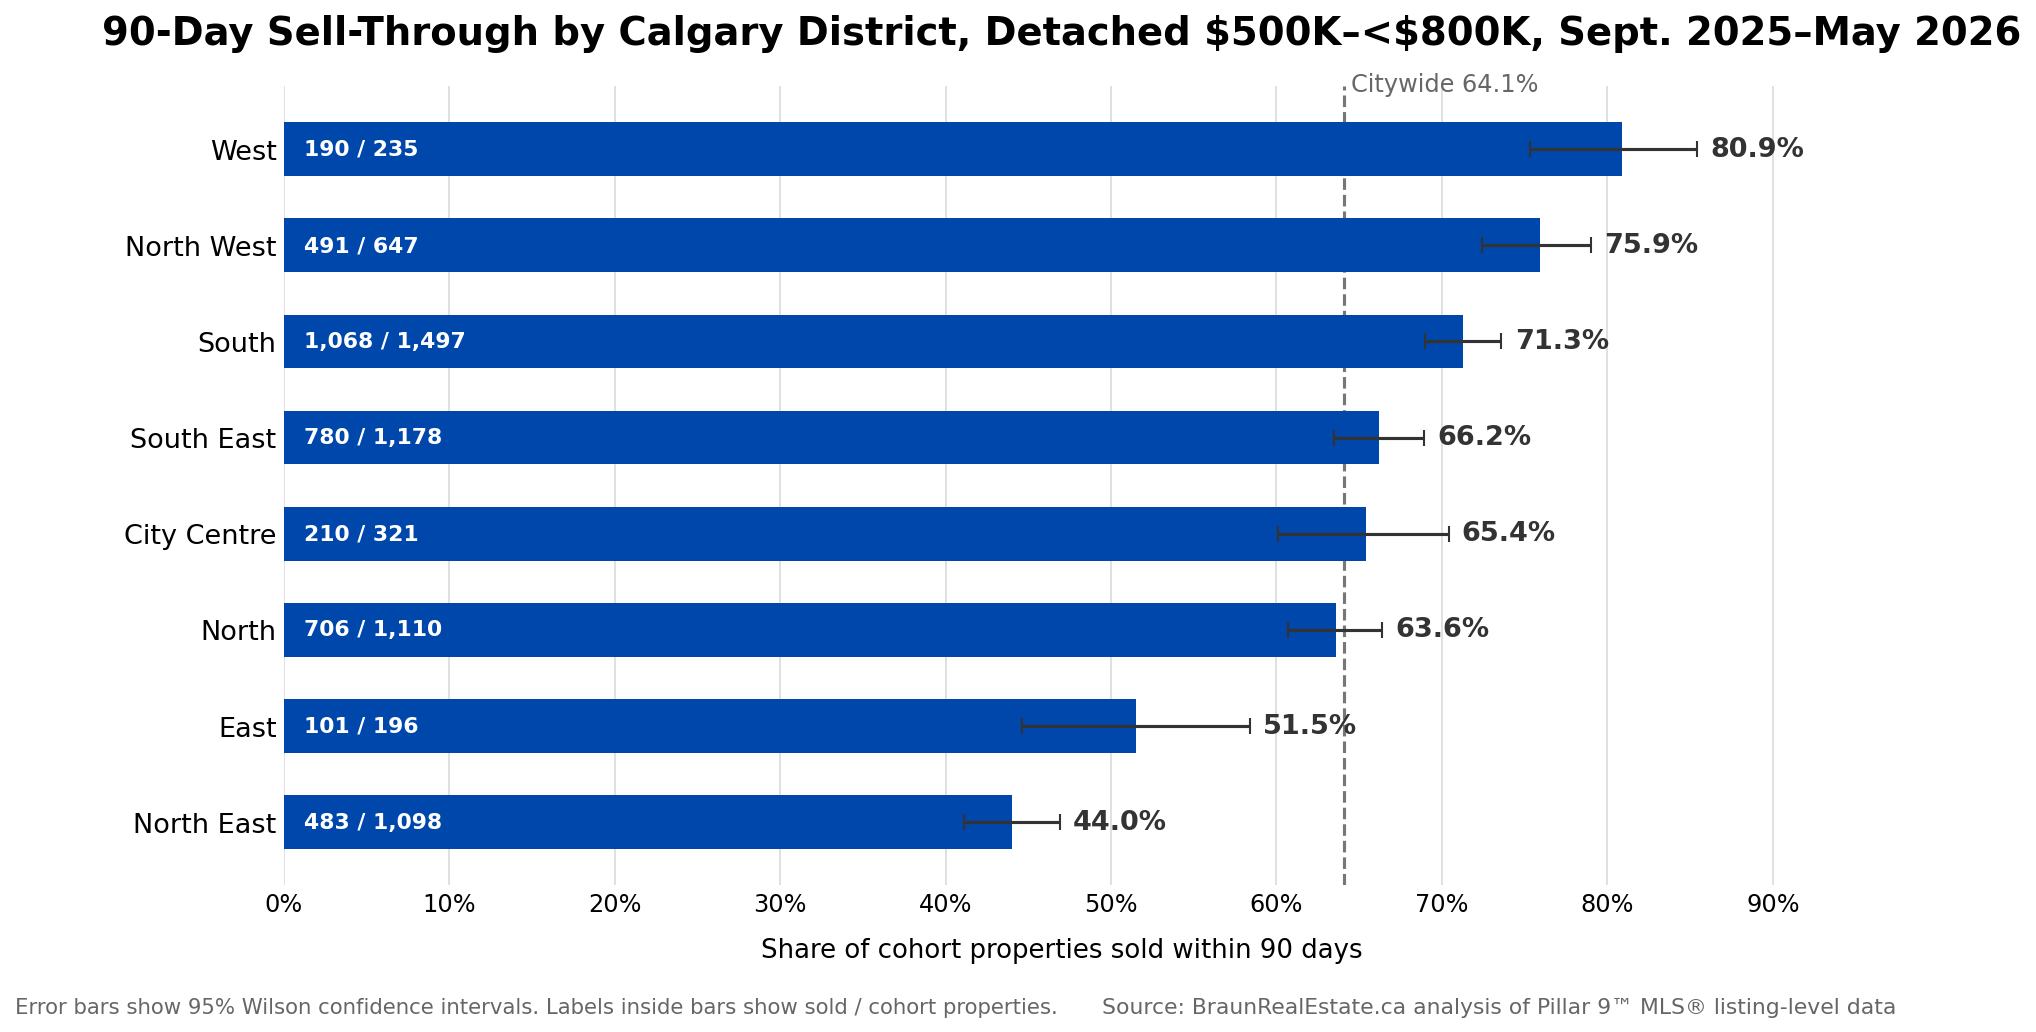
Citywide, 64.1% sold within 90 days. But the district results ranged from 80.9% in West Calgary to 44.0% in North East Calgary.
64.1% of the 6,282-property cohort sold within 90 days.
West: 190 of 235 properties sold within 90 days — 80.9%.
North East: 483 of 1,098 properties sold within 90 days — 44.0%.
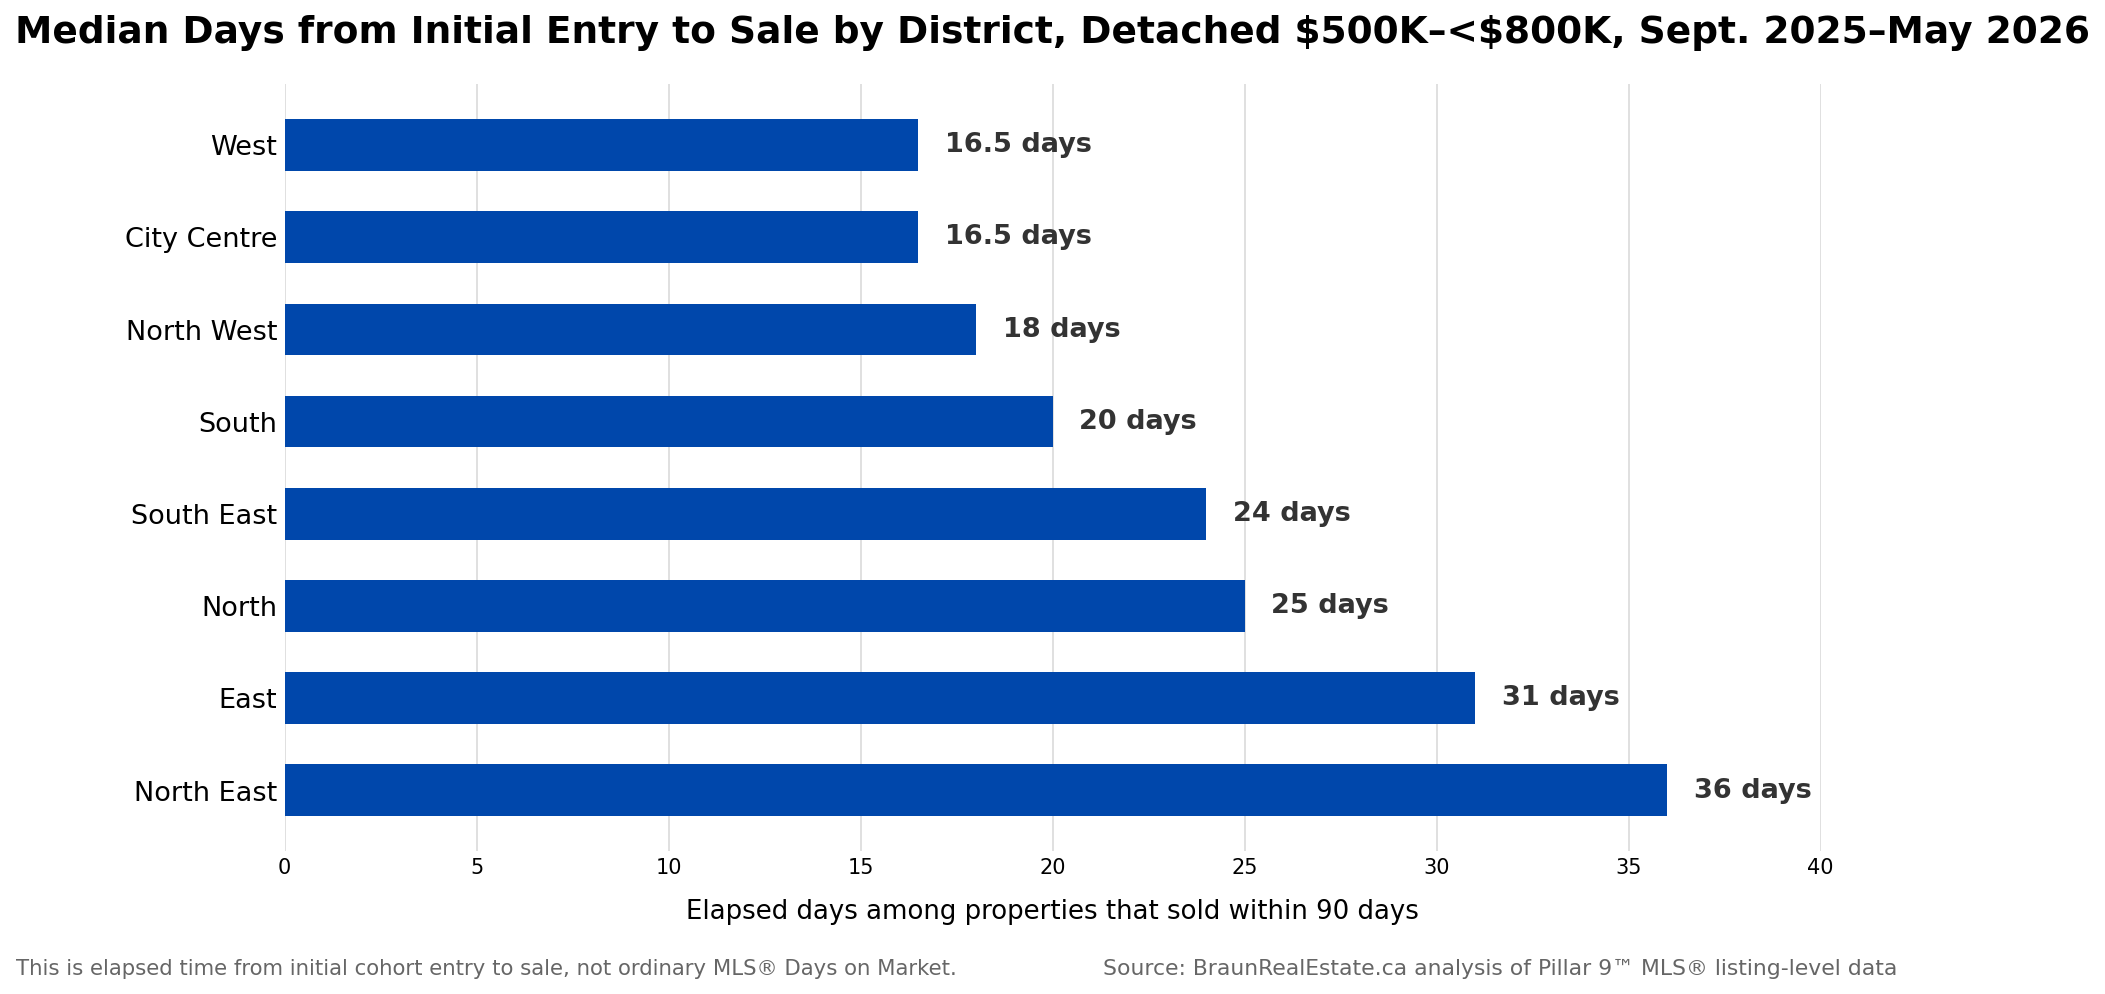
Among properties that did sell within 90 days, median elapsed time ranged from 16.5 days in West and City Centre to 36 days in North East.
The result does not mean district alone determines whether a property sells. District captures many differences in housing stock, communities, lots, competing inventory and buyer demand. But it does show that asking price alone does not define the market a detached Calgary home faces.
District Results Time to Sale Robustness Checks August Context What It Means Methodology
The main comparison uses a fixed 90-day observation window. A property counts as sold within 90 days when any listing at the same normalized address records a sale within 90 days of the property's initial cohort entry.
| District | Cohort properties | Sold within 90 days | 90-day sell-through | 95% CI |
|---|---|---|---|---|
| West | 235 | 190 | 80.9% | 75.3%–85.4% |
| North West | 647 | 491 | 75.9% | 72.4%–79.0% |
| South | 1,497 | 1,068 | 71.3% | 69.0%–73.6% |
| South East | 1,178 | 780 | 66.2% | 63.5%–68.9% |
| City Centre | 321 | 210 | 65.4% | 60.1%–70.4% |
| North | 1,110 | 706 | 63.6% | 60.7%–66.4% |
| East | 196 | 101 | 51.5% | 44.6%–58.4% |
| North East | 1,098 | 483 | 44.0% | 41.1%–46.9% |
| Calgary cohort | 6,282 | 4,029 | 64.1% | — |
The district spread is substantial. West's observed 90-day rate was 36.9 percentage points above North East's. The confidence intervals also help show the uncertainty around each estimate, particularly in smaller cohorts such as West and East.
This comparison does not say that two otherwise identical houses would have these exact outcomes solely because they sit in different districts. It measures what actually happened to properties entering these district markets within the defined price range and period.
The district pattern also appears when we look only at the 4,029 cohort properties that sold within 90 days.
| District | Median days from initial cohort entry to sale |
|---|---|
| West | 16.5 |
| City Centre | 16.5 |
| North West | 18 |
| South | 20 |
| South East | 24 |
| North | 25 |
| East | 31 |
| North East | 36 |
These figures are calculated from the property's initial cohort entry date to its eventual sale date. That distinction matters because this analysis follows the property across a subsequent listing when necessary.
A $500,000-to-$800,000 range is useful for sample size, but the mix of homes within that range is not identical across districts. I therefore tested whether the broad pattern persisted under narrower or adjusted comparisons.
| District | Base $500K–<$800K | $600K–<$700K only | Excluding 2020+ construction | Adjusted probability |
|---|---|---|---|---|
| West | 80.9% | 82.5% | 80.9% | 82.5% |
| North West | 75.9% | 76.0% | 76.1% | 73.9% |
| South | 71.3% | 73.7% | 76.3% | 71.3% |
| South East | 66.2% | 65.2% | 75.0% | 68.6% |
| City Centre | 65.4% | 69.1% | 65.6% | 66.8% |
| North | 63.6% | 64.5% | 68.0% | 63.7% |
| East | 51.5% | 48.3% | 53.8% | 47.1% |
| North East | 44.0% | 44.2% | 45.4% | 41.7% |
The narrower $600,000-to-under-$700,000 test contains 2,413 properties. The test excluding homes built in 2020 or later contains 5,328 properties. The broad district ordering remains recognizable in both.
The “Adjusted probability” column comes from a logistic regression model that accounts for differences in asking-price band, construction era, above-grade home size and listing month. For each district, it estimates what the 90-day sell-through rate would look like if each district were evaluated using the same overall mix of those characteristics. The purpose is to test whether the district pattern remains after some obvious differences in housing mix are accounted for.
The adjusted analysis is still descriptive, not causal. It cannot fully account for condition, renovations, lot characteristics, exact community, competing inventory, seller motivation or other property-level differences that may also affect the outcome.
As a separate snapshot, I compared August 2026 active detached listings with August sales in the same $500,000-to-under-$800,000 final-list-price range.
| District | Active listings | August sales | Active listings per August sale |
|---|---|---|---|
| West | 38 | 25 | 1.52 |
| North West | 138 | 75 | 1.84 |
| South | 326 | 130 | 2.51 |
| South East | 262 | 95 | 2.76 |
| North | 299 | 89 | 3.36 |
| City Centre | 86 | 25 | 3.44 |
| North East | 352 | 65 | 5.42 |
| East | 71 | 13 | 5.46 |
This measure is intentionally called Active listings per August sale. It is a simple one-month contextual ratio, not Months of Supply and not the same measure as the 90-day cohort analysis.
The August snapshot is directionally consistent with the broader sell-through pattern: districts with higher 90-day cohort sell-through generally had fewer active listings per August sale. That relationship is useful context, but the one-month ratio does not establish why the earlier cohort outcomes differed.
A citywide statistic can be a poor substitute for the competitive conditions surrounding a specific property. A detached home entering at $650,000, for example, is not competing with every other $650,000 detached home in Calgary. Its alternatives are shaped heavily by location, housing stock and the inventory buyers are actually considering.
That means pricing decisions should be informed by the property's local competitive set, not just a citywide benchmark or a broad price band.
The same asking price can represent different levels of market competition in different parts of Calgary. A listing's district does not tell you what will happen to that individual property, but local sell-through, available alternatives and marketing history can provide useful context when assessing how much negotiating leverage may exist.
Want broader Calgary market context? Review the latest Calgary market reports for sales, inventory, Months of Supply and price trends by property type and district.
This analysis uses Pillar 9™ MLS® listing-level data for Calgary residential properties. The source dataset contains 48,984 listing records and sale-date information through August 31, 2026.
The primary cohort contains 6,282 unique detached properties with an Original List Price of at least $500,000 and under $800,000 and a qualifying initial Listing Contract Date from September 1, 2025 through May 31, 2026.
Addresses are normalized by trimming whitespace, collapsing repeated whitespace and standardizing case. A candidate listing is treated as a fresh market entry only when the same normalized address had no listing with a Listing Contract Date in the preceding 90 days. If an address produced more than one qualifying fresh entry during the cohort period, only the first was retained.
The May 31 entry cutoff allows every property a complete 90-day observation window using sale data through August 31.
A property is classified as sold within 90 days when any listing at the same normalized address has MlsStatus recorded as Sold and a Close Date from the cohort entry date through 90 days after entry, inclusive.
This property-level approach matters when a home is terminated or expires and is subsequently relisted. Of the 4,029 properties that sold within 90 days, 3,754 sold on the original cohort listing, 274 sold on a later relisting, and one sold on another listing created the same day. The remaining 2,253 properties did not record a sale within the 90-day window.
90-day sell-through rate = properties sold within 90 days ÷ properties entering the cohort.
The confidence intervals shown for district sell-through rates are 95% Wilson intervals. A more aggressive alphanumeric-only address normalization changes the cohort from 6,282 to 6,281 properties and leaves every district sell-through percentage unchanged at one decimal place.
The adjusted model uses sold-within-90-days as the outcome and includes district, original asking-price band, construction era, above-grade living-area quartile and listing month. Adjusted percentages are marginal standardized probabilities. They should be interpreted as a descriptive robustness check, not as causal effects of district.
Data is deemed reliable but is not guaranteed accurate. The trademarks MLS®, Multiple Listing Service® and the associated logos are owned by The Canadian Real Estate Association (CREA) and identify the quality of services provided by real estate professionals who are members of CREA. Used under license.
Across the 6,282-property cohort, 64.1% of detached homes entering from $500,000 to under $800,000 sold within 90 days.
But that citywide number concealed substantial district variation. The observed rate ranged from 80.9% in West to 44.0% in North East, and the broad pattern remained after narrowing the price range, excluding newer construction and statistically adjusting for several observable property characteristics.
The analysis does not establish that district causes those outcomes. It does establish something more practical: price alone is not enough to describe the market a Calgary detached home is entering.