
September 2026 left Calgary's overall housing market balanced, but the city-wide result masks a clear split by property type and district. Detached and semi-detached activity remained comparatively resilient, while row and apartment markets carried more supply relative to sales and weaker price momentum. This report traces how Calgary reached that position, where conditions differ most, and what buyers and sellers should monitor next.
Executive Summary
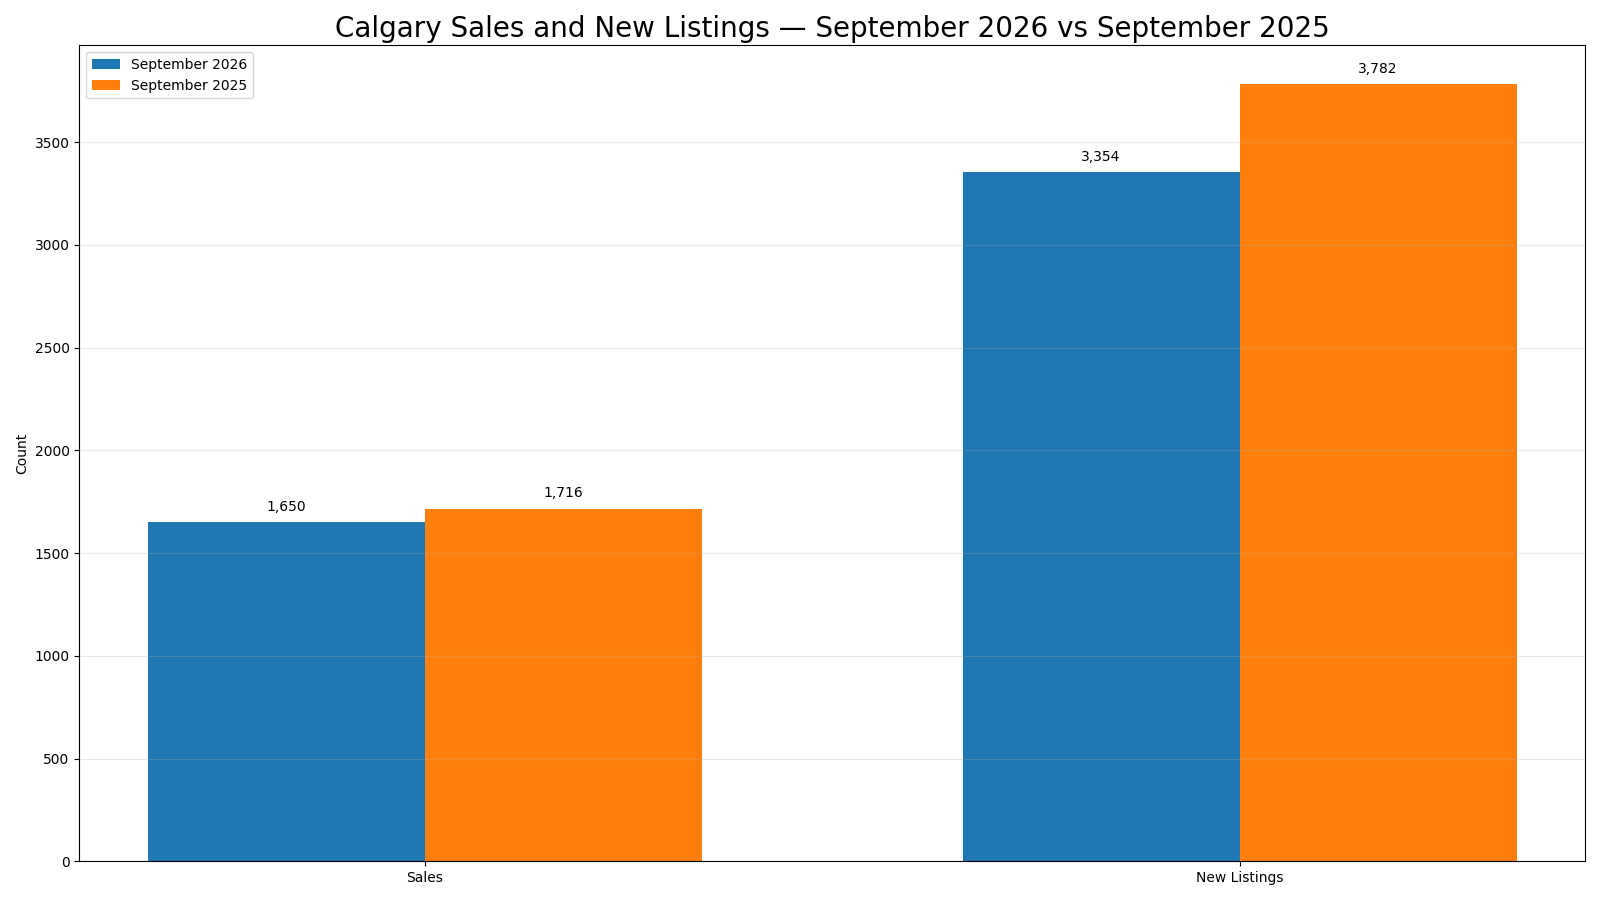
Calgary finished September 2026 in a balanced overall position, with 3.93 months of supply. The city-wide benchmark price was $566,700, down 0.82% from September 2025. Sales were 3.85% lower year over year, but new listings fell more sharply, by 11.32%, while inventory declined 6.26%. That combination kept overall supply from expanding further even as market activity remained below last year's level.
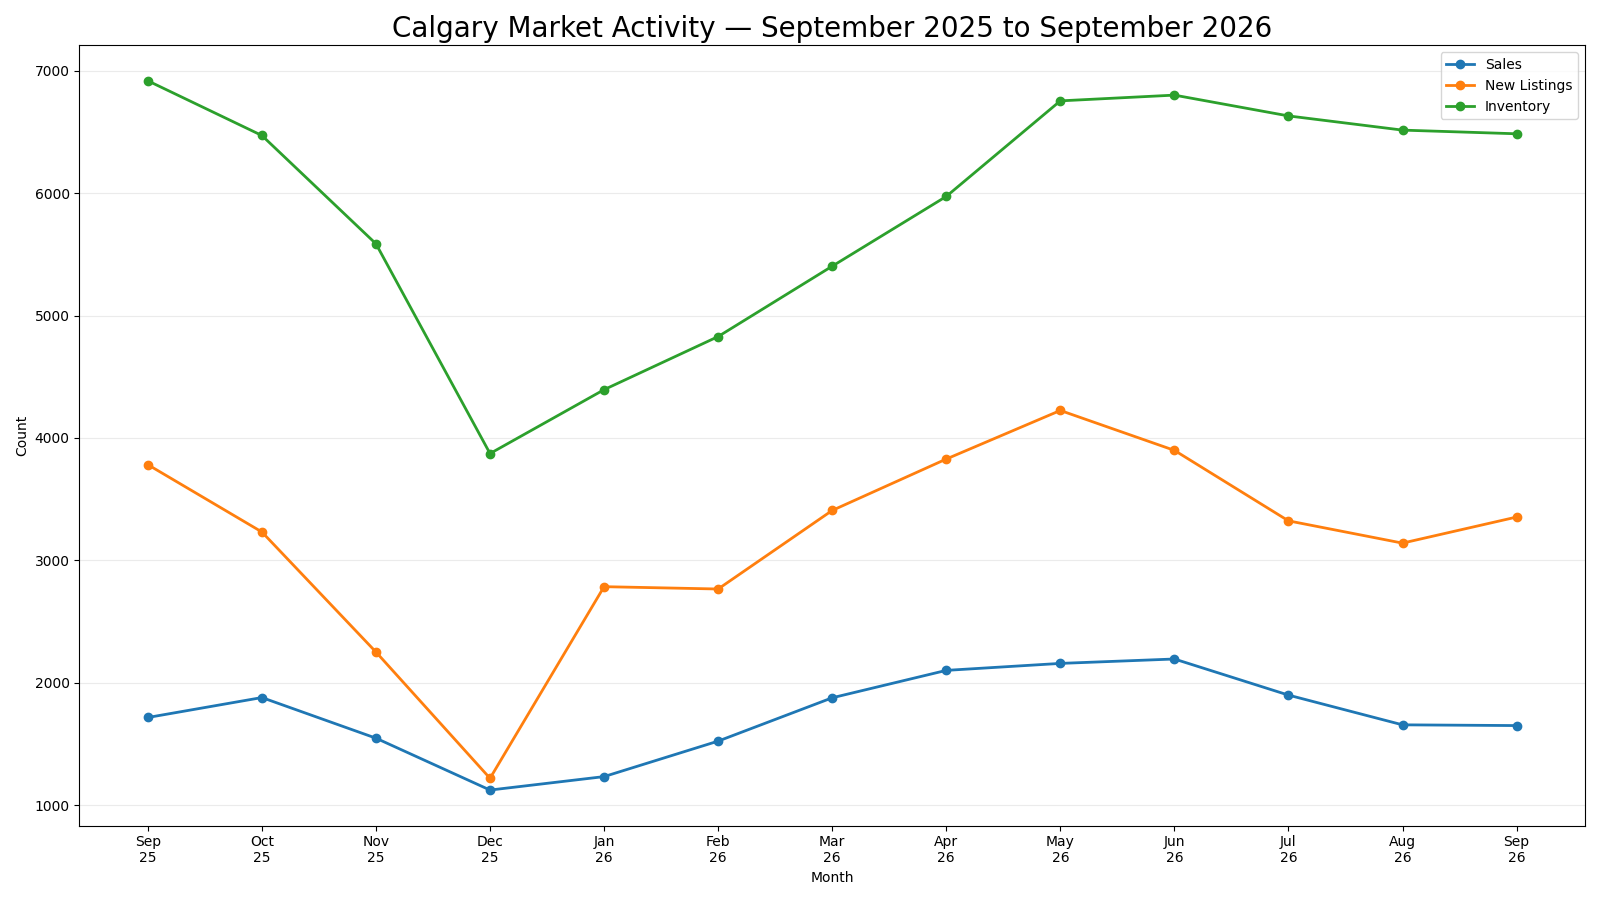
The broader trajectory shows a market that rebuilt inventory through the first half of 2026 and then entered the autumn with sales below their early-summer peak while inventory eased only gradually. That has left buyers with more choice than in the tighter conditions seen earlier in the cycle, without pushing the city-wide measure decisively into buyer's-market territory.
The most important distinction is beneath the city total. Detached and semi-detached sales increased year over year and both carried less than four months of supply, with benchmark prices roughly stable from a year earlier. Row and apartment sales fell materially, months of supply were higher, and benchmark prices were down more noticeably. Geography adds another layer: several districts show relatively tight detached or semi-detached supply while row or apartment supply in the same district is substantially higher.
For buyers and sellers, the practical conclusion is that Calgary's balanced headline should not be treated as a uniform negotiating environment. Property type and district now matter materially to pricing, competition, choice and expected marketing time. The next signal to watch is whether autumn sales soften faster than inventory declines, or whether supply contracts enough to keep the city within its present balanced range.
Calgary Market at a Glance
How Market Conditions Are Changing
Calgary entered the current 13-month window with 1,716 sales in September 2025. Activity then moved through the late-year slowdown, reaching 1,123 sales in December as new listings and inventory also fell. The market rebuilt quickly after the turn of the year: sales rose from 1,233 in January to 2,194 in June, while new listings climbed to 4,225 in May and inventory reached 6,802 in June.
The second half of the period shows a different relationship. Sales eased from the June high to 1,899 in July, 1,656 in August and 1,650 in September. Inventory declined more slowly, moving from 6,802 in June to 6,486 in September. New listings also retreated from their spring peak, although September's 3,354 new listings were above August's 3,141. The result is a market with less demand pressure than in early summer but still enough supply contraction to prevent inventory from continuing to build.
September's official 3.93 months of supply places the city within the balanced range and just below the 4.0-month threshold for a buyer's market. Compared with September 2025, sales were down 3.85%, inventory was down 6.26%, and new listings were down 11.32%. Because incoming supply and total inventory both fell more than sales year over year, the current balance is slightly tighter than the 4.03 months of supply reported one year earlier even though sales activity itself is lower.
Price movement has been restrained rather than abrupt. The September benchmark was $566,700, down 0.82% year over year, while days on market increased to 44 from 42. Together, the activity, supply and price measures describe a market that has moved away from the tighter conditions of spring and early summer but has not developed the broad excess supply that would characterize a city-wide buyer's market.
Where the Market Is Diverging
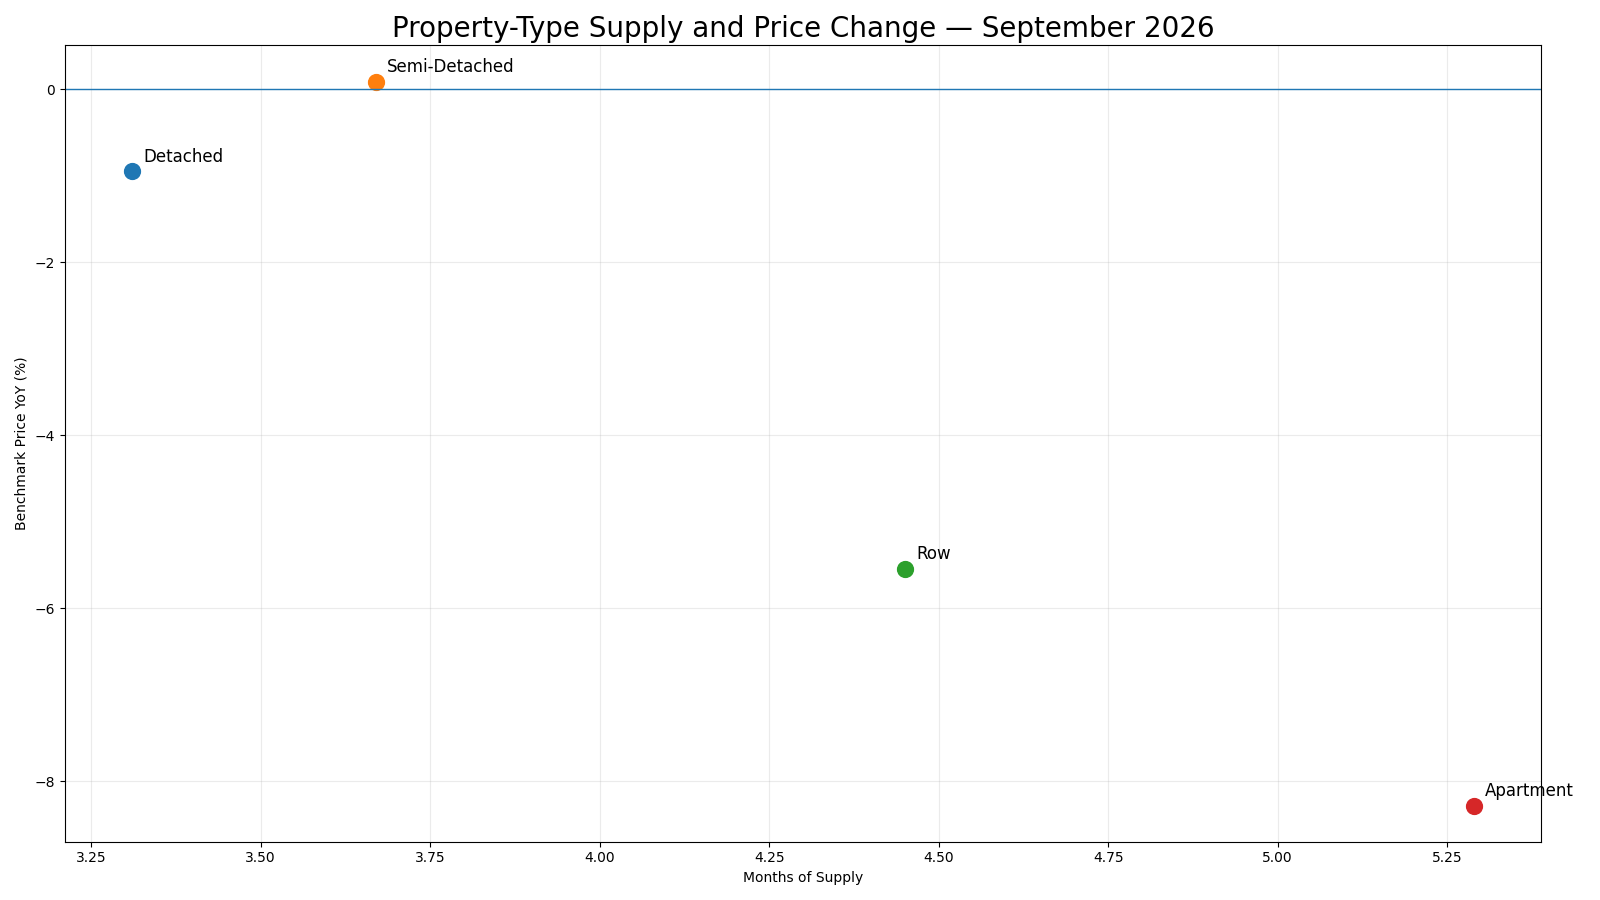
The city-wide balance conceals a substantial difference between the two lower-supply property types and the row and apartment segments. Detached sales rose 4.43% year over year while inventory fell 7.28%. With 3.31 months of supply and a benchmark price down only 0.95%, detached homes show comparatively firm demand relative to available supply.
Semi-detached homes present a similar, though slightly less tight, pattern. Sales increased 5.16% from a year earlier, inventory declined 3.23%, and months of supply stood at 3.67. The benchmark price was effectively unchanged, up 0.09% year over year. These indicators do not point to accelerating price pressure, but they do show a segment where sales have held up while available supply has contracted.
The two stronger segments are therefore aligned on activity and supply, but not on price acceleration. That distinction matters. Higher sales and lower inventory are consistent with firmer competitive conditions, yet the detached benchmark remains slightly below last year and the semi-detached benchmark is essentially flat. The evidence supports relative resilience, not a conclusion that either segment has returned to broad seller-driven price growth.
Row housing is weaker on both activity and price response. Sales fell 18.15% year over year while inventory edged 0.73% higher. Months of supply increased to 4.45 and the benchmark price was down 5.54%. Unlike the detached and semi-detached segments, row housing combines softer demand with slightly more inventory, giving buyers more choice relative to the pace of sales.
Apartments show the clearest demand-side weakness. Sales were down 14.25% year over year. Inventory also fell, by 9.38%, but the reduction in available units was not enough to offset slower sales: months of supply reached 5.29, the highest of the four property types, and the benchmark price was 8.28% below September 2025. This is an important counterexample to a simple supply story. Inventory can decline while market conditions still loosen when sales weaken enough to leave more months of available supply.
Taken together, the four segments explain why the city-wide benchmark can appear relatively stable while individual buyers and sellers experience very different markets. Detached and semi-detached homes are operating with comparatively resilient sales and lower months of supply. Row and apartment markets carry more supply relative to current sales and have experienced larger year-over-year benchmark declines. The divergence is therefore visible across demand, supply balance and price response rather than in a single isolated metric. That segmented pattern also explains how the city-wide result can stay balanced while individual property types move in materially different directions.
| Property Type | Sales Year-over-Year Change | Inventory Year-over-Year Change | Months of Supply | Benchmark Price Year-over-Year Change |
|---|---|---|---|---|
| Detached | 4.43% | -7.28% | 3.31 | -0.95% |
| Semi-Detached | 5.16% | -3.23% | 3.67 | 0.09% |
| Row | -18.15% | 0.73% | 4.45 | -5.54% |
| Apartment | -14.25% | -9.38% | 5.29 | -8.28% |
Geographic Differences
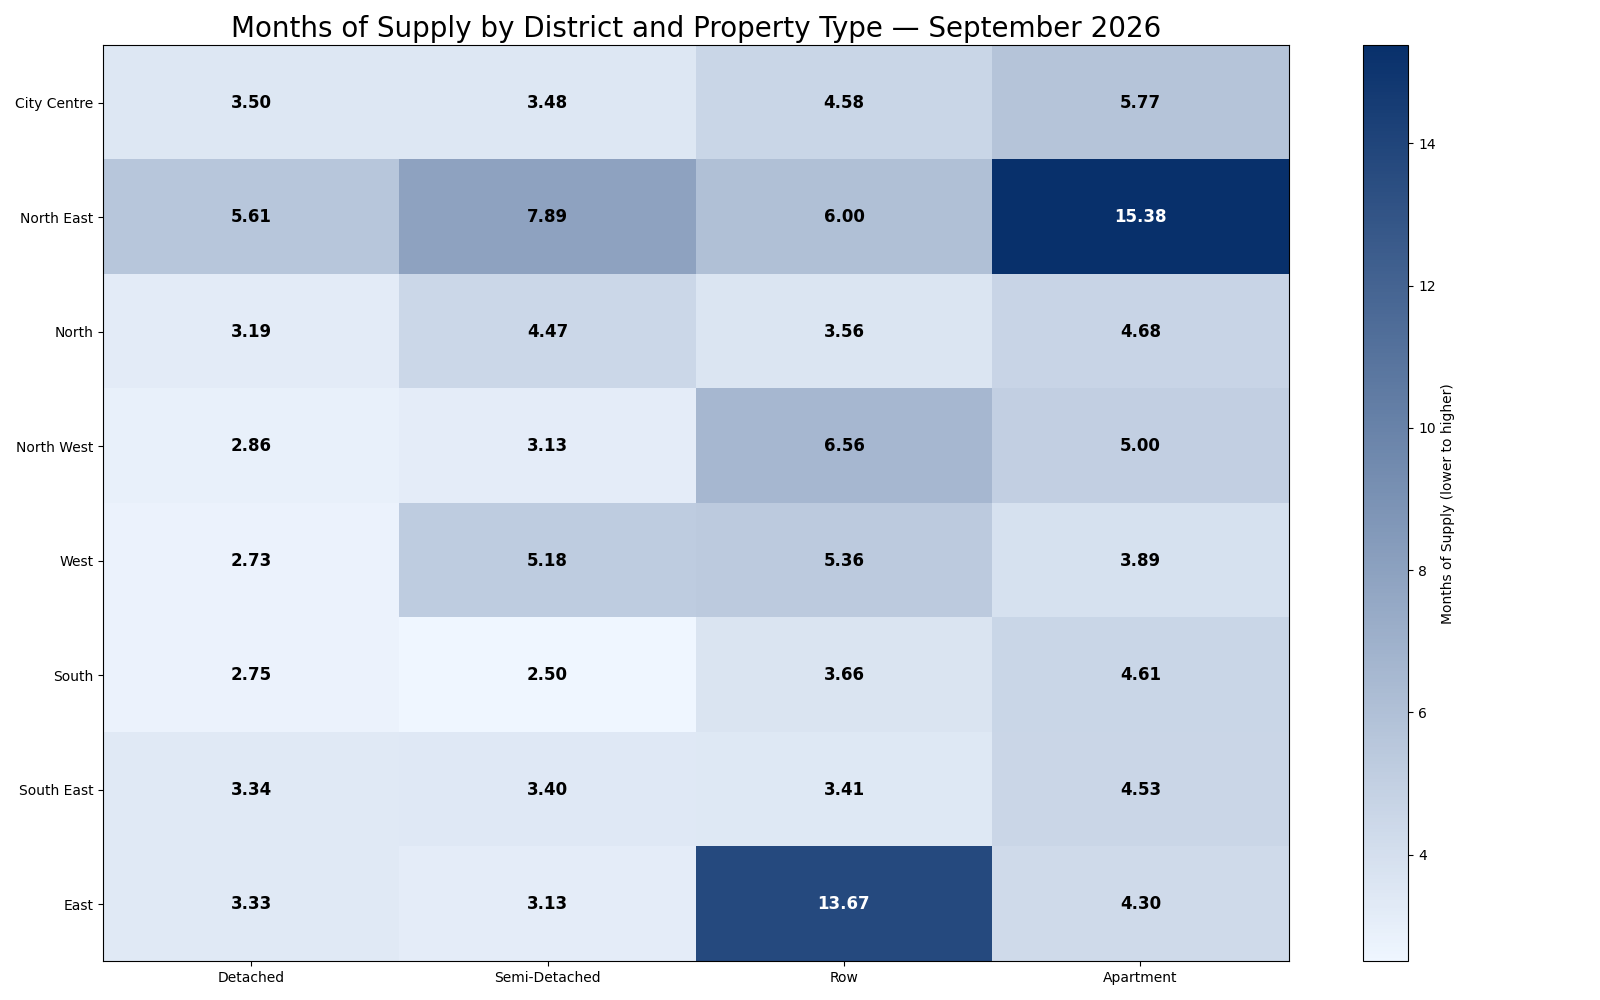
The district matrix reinforces that property type changes the meaning of location. Detached supply is generally moderate across most districts, with the West, South and North West below three months of supply, while the North East is materially higher at 5.61. Semi-detached conditions are also relatively tight in the South and North West but substantially more supplied in the North East and West.
The strongest geographic divergence appears in row and apartment housing. Row supply is notably elevated in the East, North West, North East and West, while the South East, North and South are considerably lower. Apartment supply is above four months in nearly every district except the West, and the North East stands apart with a particularly high level.
Several districts therefore contain two different markets at once. The City Centre, for example, has moderate detached and semi-detached supply but higher row and apartment supply. The North West shows a similar split, with detached and semi-detached conditions much tighter than row housing. These contrasts make a single district-wide label unreliable: the relevant question is not only where a property is located, but which property type is being compared within that district.
| District | Detached | Semi-Detached | Row | Apartment |
|---|---|---|---|---|
| City Centre | 3.50 | 3.48 | 4.58 | 5.77 |
| North East | 5.61 | 7.89 | 6.00 | 15.38 |
| North | 3.19 | 4.47 | 3.56 | 4.68 |
| North West | 2.86 | 3.13 | 6.56 | 5.00 |
| West | 2.73 | 5.18 | 5.36 | 3.89 |
| South | 2.75 | 2.50 | 3.66 | 4.61 |
| South East | 3.34 | 3.40 | 3.41 | 4.53 |
| East | 3.33 | 3.13 | 13.67 | 4.30 |
What Is Driving the Market
The September evidence fits together around one central mechanism: demand is not being absorbed evenly across Calgary's housing stock. The city-wide months-of-supply measure remains balanced because tighter and looser segments offset one another, but that average hides where sales are holding up and where available supply is taking longer to clear.
Detached and semi-detached homes illustrate the firmer side of that relationship. Their sales increased from a year earlier while inventory declined, keeping supply relative to sales comparatively contained and limiting benchmark-price movement. Row and apartment markets show the opposite mechanism. Sales fell materially; in row housing inventory was slightly higher, while in apartments inventory declined but not enough to compensate for weaker demand. Higher months of supply in both segments coincides with larger benchmark-price declines.
The district evidence shows the same process at a finer scale. Where a property type has relatively low months of supply, buyers face less choice even when another property type in the same district is well supplied. Conversely, high row or apartment supply can create softer conditions without implying that detached homes in that district are equally loose. The important driver is therefore the relationship between segment-specific demand and available supply, not the city-wide inventory total in isolation.
What This Means for Buyers and Sellers
For buyers, the balanced city-wide reading means there is no single Calgary negotiating environment. The amount of choice and the likelihood of competing pressure depend materially on property type and district. Buyers focused on row homes or apartments generally have more supply relative to current sales than buyers pursuing detached or semi-detached homes. In districts where row or apartment months of supply are especially high, buyers can place greater emphasis on comparing alternatives, condition, fees, location within the district and recent competing listings rather than assuming that every well-presented property will move quickly.
That does not mean all buyers should expect broad discounts. Detached and semi-detached supply remains much tighter in several districts, and year-over-year sales in both segments increased. A buyer targeting those pockets should judge competition from the immediate segment, not from Calgary's overall 3.93 months of supply. The practical advantage of the current market is better differentiation: buyers can identify where patience and selection are more available and where a strong property may still attract concentrated interest.
For sellers, September places a premium on accurate segment-level positioning. Detached and semi-detached sellers have comparatively supportive supply-demand conditions, but the city is not in a broad seller's market and benchmark-price growth is limited. Pricing above the evidence still creates risk, particularly as sales have eased from their early-summer high.
Row and apartment sellers face a more demanding environment. Higher months of supply and larger year-over-year benchmark declines mean buyers have more alternatives and more evidence with which to compare value. Competitive pricing, presentation and an understanding of the immediate district and property-type inventory become more important than relying on the city-wide balanced label. Across all segments, the relevant benchmark is the closest competing market: the same property type, in the same district or nearby comparable area, under the current supply conditions.
What to Watch Next
The first relationship to watch is sales relative to inventory through the autumn. If sales continue to soften while inventory remains elevated, city-wide months of supply could move above the current balanced range; if inventory contracts faster than sales, the market could remain balanced or tighten.
The second signal is whether the property-type gap narrows. A sustained improvement in row and apartment sales, combined with lower months of supply, would indicate that excess choice is being absorbed and would reduce the pressure associated with their current benchmark-price declines. Continued weak sales relative to supply would keep that divergence in place.
Finally, watch the geographic outliers rather than only the city average. Very high row or apartment supply in specific districts matters if it persists, while tighter detached and semi-detached pockets matter if their supply begins to rise. A meaningful change would be convergence across property types within the same district, because that would indicate that the present segmented market is becoming more uniform.
Explore the Market in More Detail
Sources and Methodology
This report uses the CREB® September 2026 City of Calgary Monthly Statistics Package for city-wide, property-type and district market evidence. The analysis compares sales, new listings, inventory, benchmark prices and months of supply, including the published 13-month city activity series and the current district-by-property-type months-of-supply matrix.
Overall market status is based on Calgary's city-wide months of supply: below 2.5 months is a seller's market, 2.5 to 4.0 months is balanced, and above 4.0 months is a buyer's market. Property-type and district tables use the exact values published by CREB® for the reporting month.