
Calgary's housing market remained balanced in October 2026, but the headline conceals a marked difference between property types. Semi-detached homes had comparatively limited supply and nearly steady annual sales, while apartment and row markets showed weaker demand and larger benchmark-price declines. This report follows the city's activity and inventory changes, compares property types and districts, and explains what the evidence means for market decisions.
Executive Summary
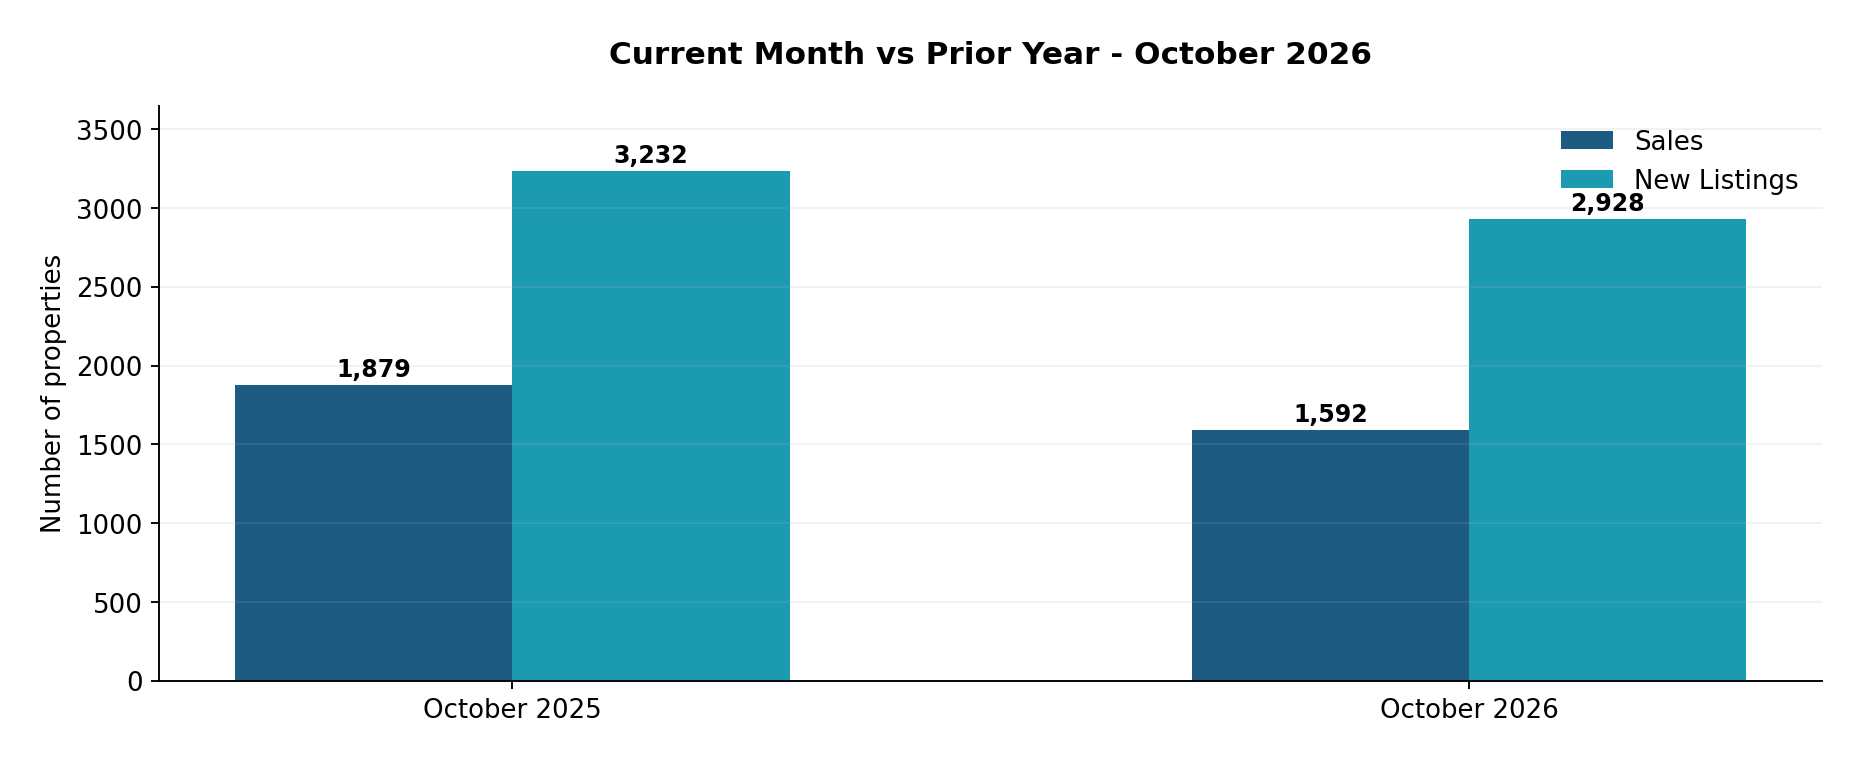
Calgary remained balanced in October 2026 at 3.88 months of supply, but conditions were less competitive than a year earlier. Sales fell 15.27% year over year to 1,592, compared with a 9.41% decline in new listings and a 4.62% reduction in inventory. Because sales contracted faster than available supply, months of supply was higher than October 2025 despite having fewer homes on the market. The city-wide benchmark price was $564,200, down a modest 0.35%.
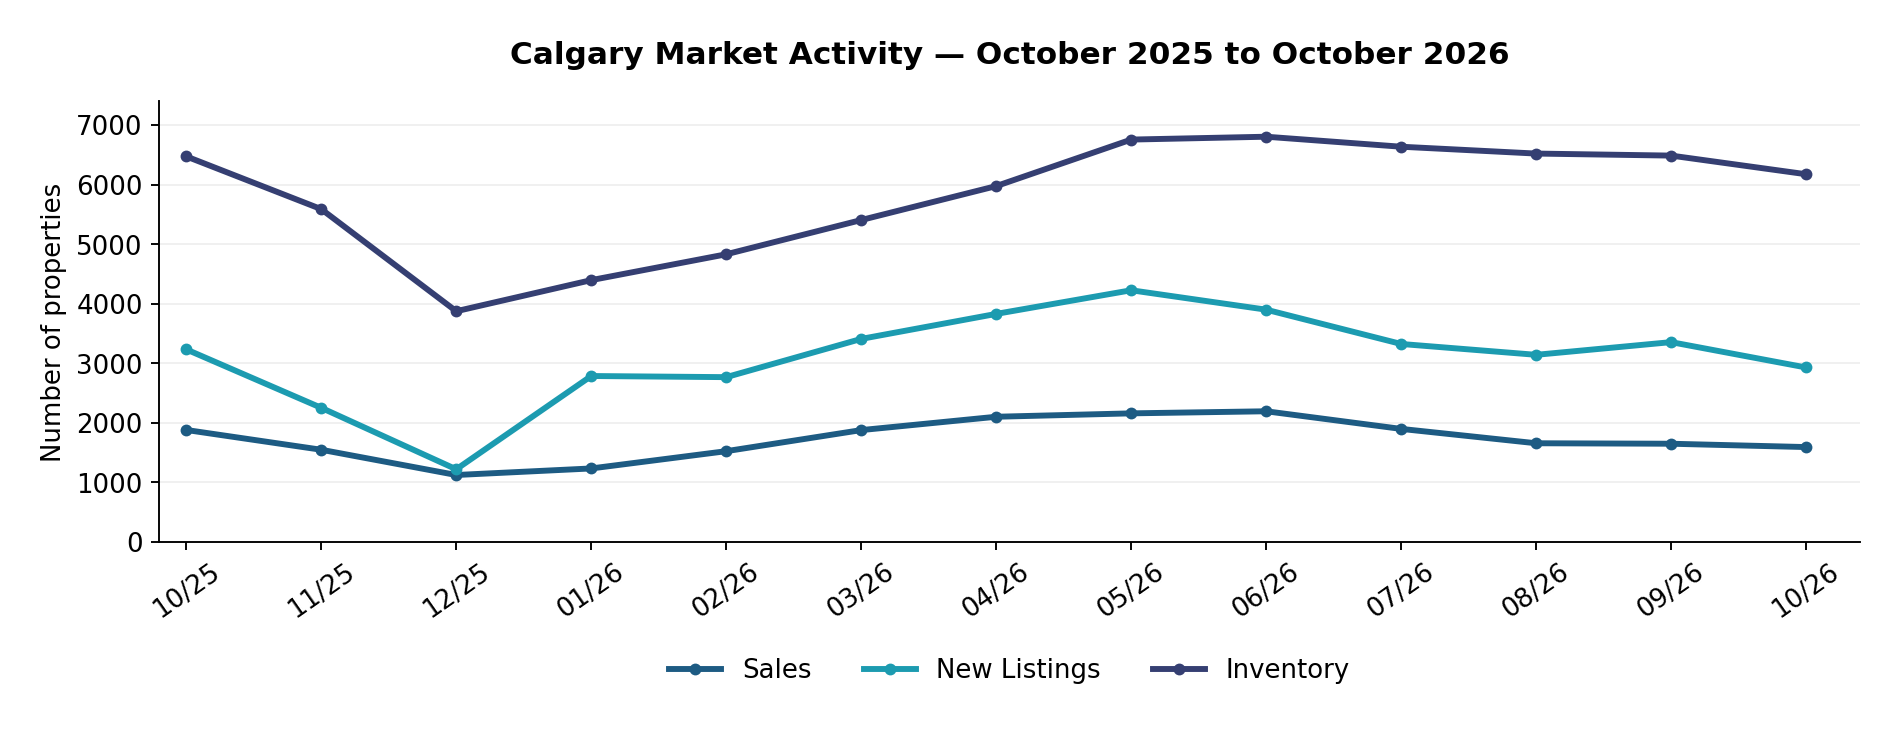
The 13-month picture explains how Calgary arrived here. Sales and inventory rebuilt through the first half of 2026, before transactions slowed from their June high and new listings and inventory eased into October. The autumn reduction in available properties has moderated the amount of choice, but it has not restored the stronger sales pace seen in the spring.
The clearest distinction is by property type. Semi-detached homes had relatively steady annual sales, lower months of supply and a slightly higher benchmark price. Detached homes also had comparatively modest benchmark-price weakness, although sales declined substantially. Row and apartment markets had more months of supply and significantly weaker benchmark trends; apartment sales fell most sharply. These differences make the balanced city-wide result an incomplete guide to individual decisions.
District evidence adds another dimension. Northern row and apartment markets carried particularly high months-of-supply readings, while several southern and western ground-oriented segments showed considerably less supply relative to sales. These contrasts mean buyers and sellers should compare the relevant property type and location rather than treat an entire district as one market.
For the months ahead, the essential question is whether sales and inventory decline in step or continue moving at different rates. That relationship, along with the persistence or narrowing of property-type differences, will show whether Calgary remains balanced or develops a clearer shift in competitiveness.
Calgary Market at a Glance
How Market Conditions Are Changing
Calgary's 13-month activity series begins in October 2025 with 1,879 sales, 3,232 new listings and 6,472 properties in inventory. Sales and new supply then contracted through the late-year seasonal slowdown. December brought 1,123 sales and only 1,219 new listings, with inventory falling to 3,873. That reduction in available properties was substantial, but it occurred alongside a much quieter transaction period rather than a surge in purchasing activity.
The first half of 2026 reversed that late-year contraction. Sales climbed to 2,193 by June, the strongest month in the 13-month series. New listings peaked earlier, at 4,225 in May, while inventory reached 6,803 in June. Incoming supply expanded alongside transactions, allowing available choice to rebuild even as sales activity increased. The relationship between those measures matters more than any one peak: stronger spring sales did not prevent inventory from rising.
Since June, sales have retreated more sharply than the available listing stock. October recorded 1,592 sales, compared with 1,648 in September and 2,193 in June. Inventory eased to 6,173 from 6,803 in June, and new listings dropped to 2,928 from September's 3,354. Supply therefore began to contract ahead of winter, but demand was also slower. The latest decline in inventory should not, on its own, be interpreted as renewed seller pressure.
Against October 2025, sales were down 15.27%, while inventory declined only 4.62% and new listings fell 9.41%. Because transactions contracted faster than the available stock, months of supply rose from 3.44 to 3.88, an increase of 12.57%. The October city-wide measure remains within the balanced range and is slightly below September's level, yet annual competitiveness has softened. The $564,200 benchmark was 0.35% below a year earlier, and average days on market remained 43. Together these indicators describe a market with meaningful choice and weaker absorption than last October, without an abrupt city-wide price adjustment.
Where the Market Is Diverging
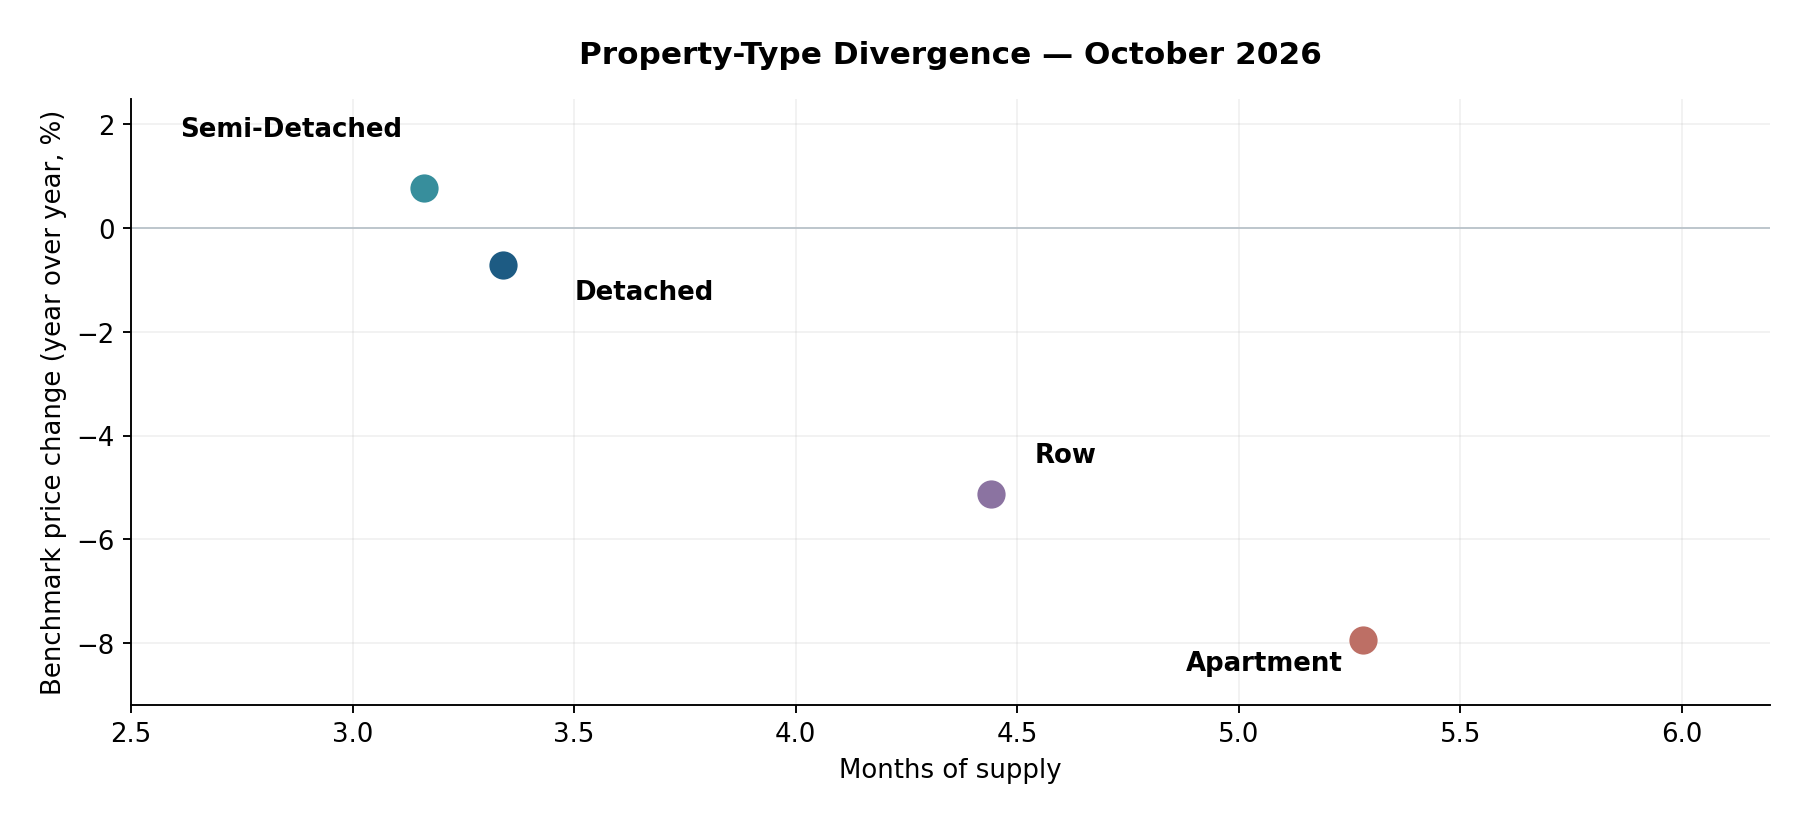
October's balanced city-wide result masks an important distinction between supply levels and sales momentum. Detached housing recorded a 15.97% year-over-year sales decline, but inventory was down only 2.78%. Months of supply stood at 3.34 and the benchmark price was 0.72% lower than last October. Detached conditions therefore remain comparatively firmer than the higher-supply segments, although the drop in sales does not support a claim of accelerating demand. Its relatively modest benchmark decline should be read alongside that clear reduction in transactions.
Semi-detached housing was the most resilient of the four types on the published annual indicators. Sales slipped only 1.08%, inventory contracted 5.22%, and months of supply was 3.16. The benchmark price rose 0.78% year over year, the only positive benchmark change among the four types. These measures are consistent with steadier demand relative to available supply, not evidence that every semi-detached community is competitive. The district evidence later in the report identifies considerable geographic variation even within this comparatively firm segment.
Row homes presented a different balance. Sales were 11.72% lower year over year, while inventory increased 1.33%. With 4.44 months of supply, the segment had more choice relative to the recent sales pace than detached or semi-detached properties. The 5.12% drop in the benchmark price reinforces that weaker activity has been accompanied by a materially softer price response. A small increase in inventory is not the sole explanation; it coincides with a substantially lower volume of completed sales.
Apartments again had the largest benchmark-price decline, down 7.94% from October 2025. Sales fell 22.33%, the steepest decline of the four property types. Inventory also declined, by 10.58%, but did not contract as quickly as sales, leaving 5.28 months of supply. This is the clearest example of why falling inventory does not necessarily mean tighter conditions: fewer available apartments can coexist with reduced competitive pressure when the rate of sales falls faster.
Across the four types, sales and inventory are not moving in uniform directions or at uniform speeds. Semi-detached prices have held up, detached prices are comparatively stable, and row and apartment benchmarks have fallen more substantially. The reported differences appear in sales momentum, inventory changes, months of supply and price response. Even within the same property type, supply conditions differ substantially by location, as the district matrix confirms. Buyers and sellers should consequently compare the property type and location they are dealing with, rather than apply the city-wide benchmark or market label as if it describes every segment equally.
| Property Type | Sales Year-over-Year Change | Inventory Year-over-Year Change | Months of Supply | Benchmark Price Year-over-Year Change |
|---|---|---|---|---|
| Detached | -15.97% | -2.78% | 3.34 | -0.72% |
| Semi-Detached | -1.08% | -5.22% | 3.16 | 0.78% |
| Row | -11.72% | 1.33% | 4.44 | -5.12% |
| Apartment | -22.33% | -10.58% | 5.28 | -7.94% |
Geographic Differences
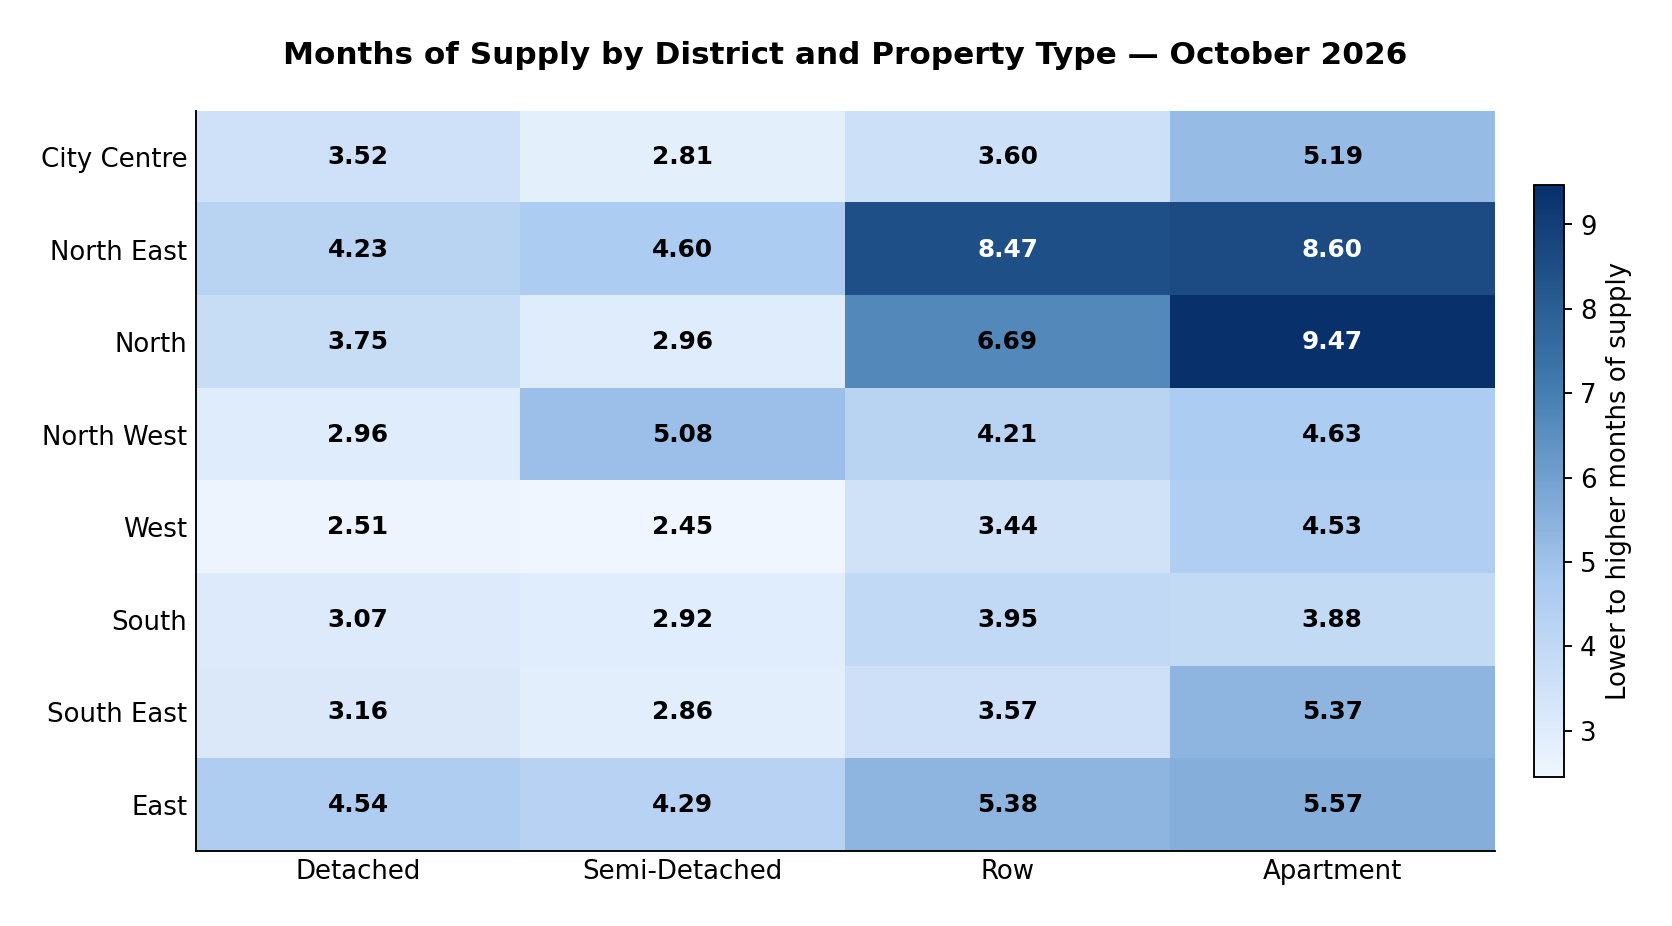
The district matrix reveals sharper contrasts than Calgary's city-wide result suggests. In the West, detached and semi-detached supply is relatively low, while apartment supply is materially higher. The South shows a similar, though less pronounced, gap between ground-oriented and apartment housing. Those patterns suggest that the amount of choice facing a buyer can change substantially without leaving the same district.
North and North East districts stand out for higher supply in row and apartment housing. North has the highest apartment months of supply in the matrix, while the North East combines comparatively elevated row and apartment readings. Those results differ markedly from semi-detached supply in the North and from detached supply across several other districts. A district-wide description would hide the distinction.
There are also important exceptions to a simple detached-versus-apartment story. North West semi-detached supply exceeds detached supply by a meaningful margin, while the East shows relatively elevated supply across all four types. In the City Centre, apartment supply is above its detached, semi-detached and row readings, but not nearly as elevated as the highest northern district results. The geographic evidence supports a property-type-specific comparison, not a single market label for any district.
| District | Detached | Semi-Detached | Row | Apartment |
|---|---|---|---|---|
| City Centre | 3.52 | 2.81 | 3.60 | 5.19 |
| North East | 4.23 | 4.60 | 8.47 | 8.60 |
| North | 3.75 | 2.96 | 6.69 | 9.47 |
| North West | 2.96 | 5.08 | 4.21 | 4.63 |
| West | 2.51 | 2.45 | 3.44 | 4.53 |
| South | 3.07 | 2.92 | 3.95 | 3.88 |
| South East | 3.16 | 2.86 | 3.57 | 5.37 |
| East | 4.54 | 4.29 | 5.38 | 5.57 |
What Is Driving the Market
The October figures show two linked processes: the seasonal withdrawal of supply and a broader reduction in the pace at which available homes are being absorbed. New listings and total inventory both declined from their spring and summer highs, but sales also weakened. The city therefore entered the cooler part of the year with fewer homes available than in early summer and less transaction activity to clear them. Falling listing counts alone cannot establish a stronger seller position.
The annual comparison clarifies that distinction. Sales fell more rapidly than total inventory, which increased months of supply even though the number of available properties was lower than a year earlier. That is an absorption issue expressed through the relationship between transactions and supply. It does not require assumptions about mortgage rates, population movements or seller motivation that these statistics cannot independently verify.
The second mechanism is segmentation. Semi-detached inventory contracted more than its sales volume, supporting a relatively low months-of-supply reading and a slightly positive benchmark change. In the apartment segment, sales contracted more rapidly than inventory, coinciding with greater months of supply and a more pronounced benchmark decline. Row housing also combined reduced sales with comparatively persistent supply. These different combinations can coexist because each property type clears against its own available stock and buyer activity.
The apparent stability of the overall benchmark is therefore not a reliable measure of individual listing competitiveness. It reflects a city-wide index in a market where demand, supply balance and prices are responding differently across types and districts. The data establishes these relationships; it does not demonstrate a single external cause behind them.
What This Means for Buyers and Sellers
For buyers, a balanced Calgary market does not mean that every property presents equal negotiating opportunity. Apartments and row homes generally have more months of available supply than detached and semi-detached homes, but the district matrix shows that differences within those categories are substantial. A buyer comparing apartments in the North with those in the South faces a different level of available selection relative to sales. Likewise, a detached buyer in the West should not assume the same level of choice as a detached buyer in the East. Comparable properties should be drawn from the relevant property type, location, condition and price range before conclusions are drawn about leverage.
Where months of supply is higher, buyers can reasonably expect more alternatives to assess and greater room to compare value. That is not a guarantee that an individual seller will negotiate or that every listing is overpriced. The more useful question is how a specific asking price compares with recent transactions and currently available substitutes. Buyers focused on lower-supply segments should still prepare for properties that attract timely attention, even though the aggregate city market is no longer exceptionally tight.
For sellers, October's softer sales pace raises the importance of matching pricing and presentation to current competition. In row and apartment markets, substantial annual sales declines alongside weaker benchmark trends make historical peak prices a less persuasive guide. An ambitious asking price needs clear support from comparable recent sales and the active alternatives buyers can choose today. If a listing is not generating meaningful response, revisiting its position against those alternatives is more useful than relying on the city-wide balanced label.
Detached sellers should also recognize that comparatively lower months of supply does not erase the large year-over-year decline in sales. Semi-detached sellers have stronger aggregate evidence, but local conditions may diverge sharply; the North West, for example, is not equivalent to the West. For both buyers and sellers, the decision framework should be segment-first: identify the relevant property type and district, evaluate current competition, then interpret price and marketing expectations using the appropriate comparables rather than broad Calgary averages.
What to Watch Next
The first measure to monitor is whether sales and inventory continue to contract at different speeds as winter approaches. If sales weaken faster than available inventory falls, months of supply could rise and conditions could become less competitive for sellers. If inventory declines more quickly, the city could remain balanced or tighten despite lower transaction volumes. The direction of that relationship matters more than a seasonal drop in listings alone.
The second measure is the property-type gap. Watch whether apartment and row sales stabilize relative to inventory and whether their benchmark declines moderate. A sustained narrowing would signal less divergence; further sales weakness against persistent supply would reinforce today's gap.
Finally, monitor district-level months of supply within each property type. A reduction in the unusually high northern apartment and row readings would suggest that some of October's localized imbalances are easing. Continued large contrasts, even with a balanced city-wide measure, would mean location-specific pricing and negotiating conditions remain essential to interpreting the next report.
Explore the Market in More Detail
Sources and Methodology
This report uses the CREB® October 2026 City of Calgary Monthly Statistics Package for city-wide, property-type and district market evidence. It compares sales, new listings, inventory, benchmark prices and months of supply, using the published 13-month city activity series and current district-by-property-type months-of-supply table.
Overall market status is based on Calgary's city-wide months of supply: below 2.5 months is a seller's market, 2.5 to 4.0 months is balanced, and above 4.0 months is a buyer's market. Property-type and district tables use the exact figures published by CREB® for October 2026.