Calgary is often described as an “oil-driven” real estate market—but what does that actually look like in the data?
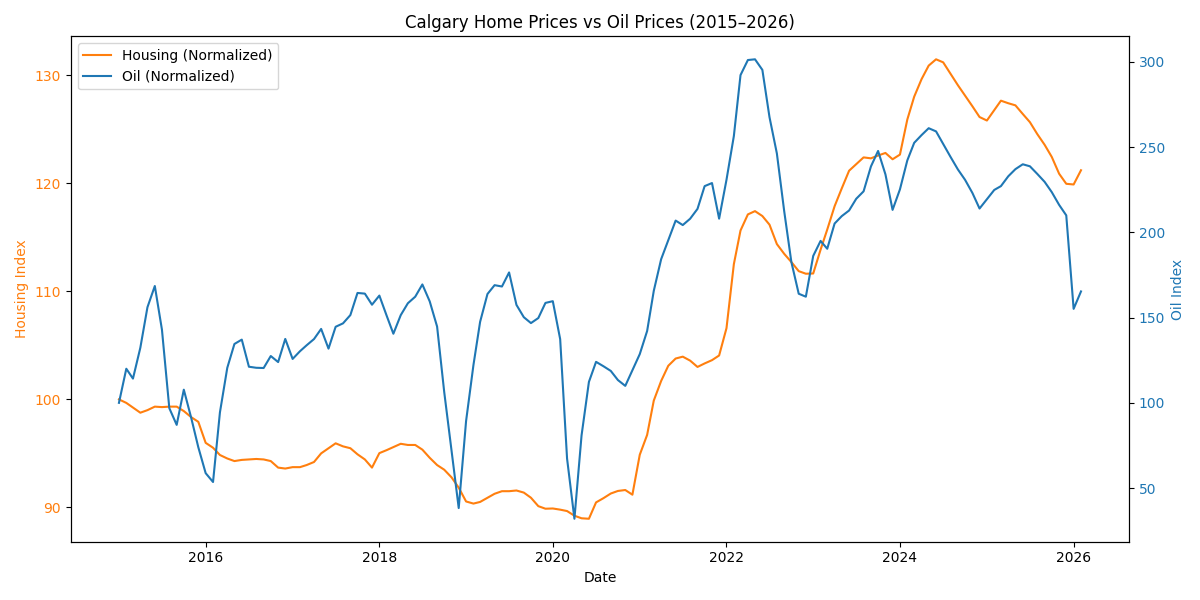
This analysis compares monthly average Western Canadian Select (WCS) oil prices—representative of Alberta’s energy market—with CREB® benchmark prices for total residential properties in Calgary. Both series are indexed to 2015 = 100, meaning they are scaled to show how much each has risen or fallen relative to its 2015 level.
What emerges is a clear relationship—but not a simple or predictive one.
The Long-Term Relationship
Over the long term, Calgary home prices and oil prices move in the same general direction, with several important turning points broadly aligning:
- the decline following the 2015–2016 oil downturn
- a gradual bottoming through 2018–2019
- a sharper disruption and recovery around 2020
- a strong rise through 2021–2022
- a plateau and mild softening from 2024 into 2025
After normalization, the two series show a close overlay in their overall shape, particularly from 2021 onward. The direction of movement is often shared even when the size and speed of the moves are not.
That distinction matters. Oil behaves like a volatile commodity. Housing behaves like a slower-moving asset. The significance of the chart is not that oil directly drives housing month by month, but that both appear to move within the same broader economic cycle.
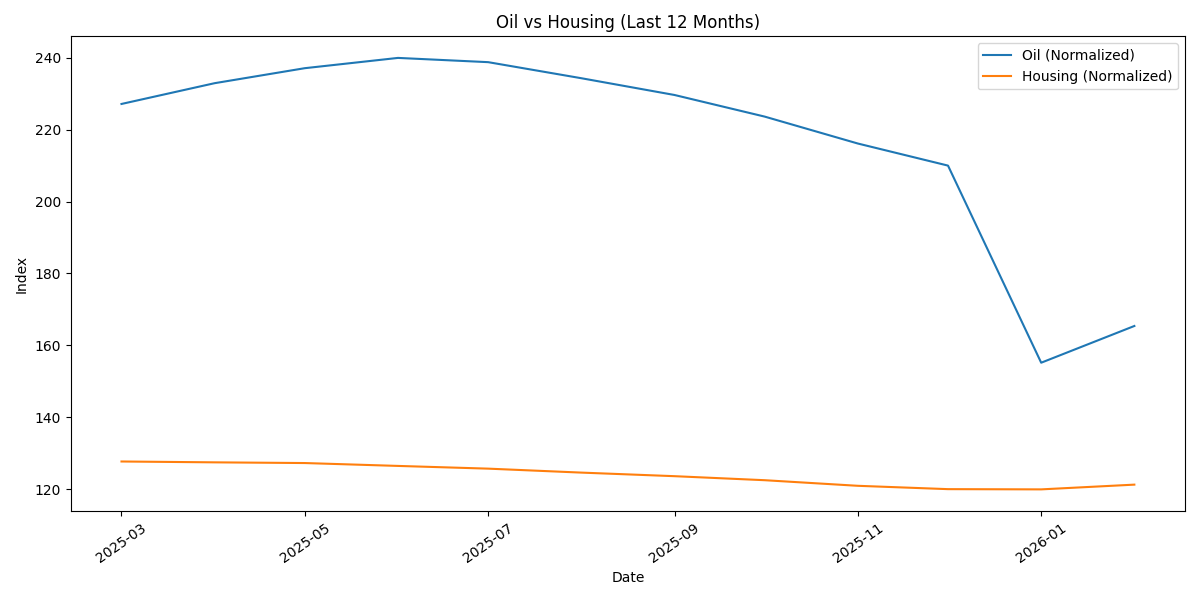
This chart shows the same 2015-based index, but zoomed in to highlight movements over the past 12 months.
Short-Term Movements Tell a Different Story
When the comparison is narrowed to the most recent 12-month period, the relationship becomes weaker.
Oil trends downward through much of the period, with a sharper drop later in the year. Calgary home prices also soften, but more gradually and with much less volatility.
Short-term movements in Calgary home prices do not closely track oil.
This is one reason broad long-term co-movement should not be mistaken for a strong short-term trading relationship. Over shorter timeframes, housing is being influenced by several other forces at the same time, including interest rates, migration, inventory conditions, and financing constraints.
Oil still matters. It is just not the only force acting on the market, and over short periods it is often not the dominant one.
Testing the Lag Hypothesis
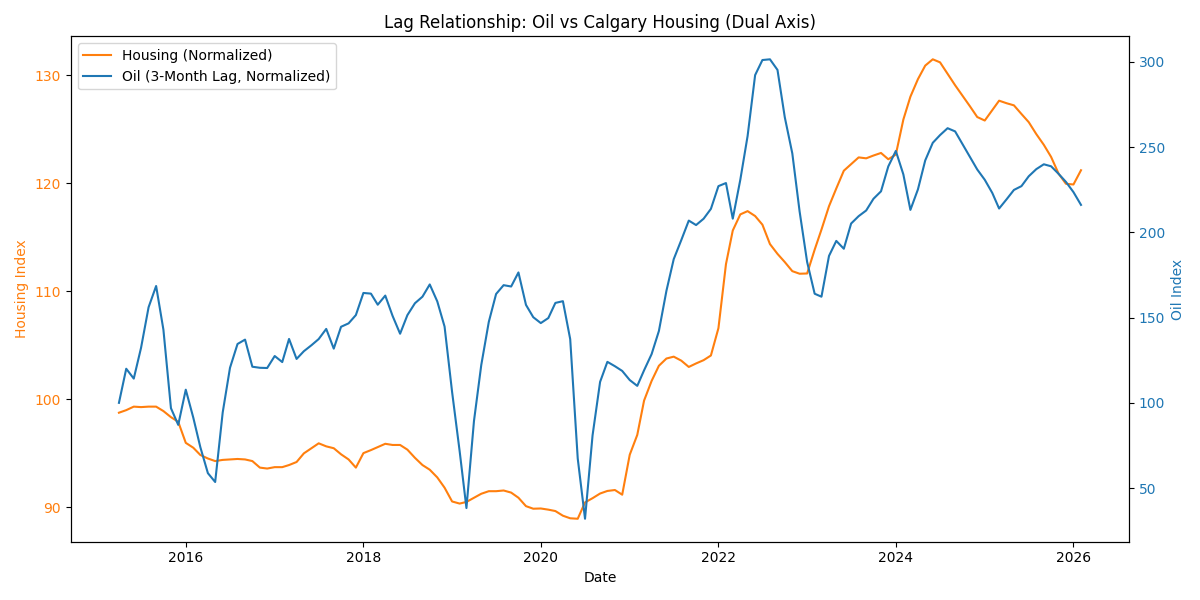
A common assumption is that oil leads Calgary housing with a delay—that changes in oil prices show up in home prices a few months later.
To test that idea, oil prices were shifted three months earlier to see whether changes in oil tend to show up in housing after a delay.
This chart is useful because it tests the expected lag directly rather than assuming it exists. The result is mixed. In some stretches, especially around the 2021–2022 rise, shifting oil forward modestly improves the visual alignment. In other periods, it does not. Overall, the lagged comparison does not become clearly tighter or more convincing than the non-lagged long-term comparison.
There is no reliable or repeatable lag where oil consistently leads Calgary home prices.
That does not mean there is no relationship. It means the relationship is not cleanly predictive in timing. Oil and housing appear to share a broader cycle, but the data does not show a stable delay that could be used confidently as a forecasting tool.
What the Data Actually Shows
Taken together, the charts point to a relationship that is real, but more nuanced than the usual shorthand suggests.
1. There is clear long-term directional alignment
Calgary home prices and oil prices share similar turning points and broadly aligned multi-year trends. That is visible in the long-term chart and is too consistent to dismiss as coincidence.
2. The relationship is not proportional
Oil moves much more dramatically than housing. Housing follows the broader direction more gradually and with smaller swings.
3. The short-term relationship is weaker
Once the timeframe is narrowed, the lines diverge more easily. This suggests that whatever relationship exists is much more useful for understanding broad cycles than for interpreting month-to-month movement.
4. The lag effect is inconsistent
There are periods where oil appears to move ahead of housing, but not in a stable or repeatable way. The lag test does not establish a dependable timing relationship.
5. The connection is structural, not mechanical
The most reasonable interpretation is not that oil directly and immediately drives housing, but that both are responding to the same underlying economic environment.
Oil reflects conditions tied to Alberta’s energy sector, including investment, employment, and business confidence. Housing reflects those same conditions along with borrowing costs, migration, and supply constraints. The relationship exists, but it is indirect.
What This Means for Buyers and Sellers
For anyone trying to interpret Calgary’s real estate market, oil trends still provide useful context—but not a complete answer.
They can help explain the broader economic backdrop. They do not, on their own, provide a reliable short-term signal for where housing is going next.
That means buyers and sellers should be cautious about reading too much into oil alone. A better read on the market comes from looking at oil alongside interest rates, inventory, migration, and current demand conditions.
Frequently Asked Questions
Do oil prices predict Calgary house prices?
No. While Calgary home prices and oil prices tend to move in the same direction over longer periods, the relationship is not strong enough to be used as a predictive tool for short-term price movements.
How long is the lag between oil and real estate?
There is no consistent or reliable lag. In some periods oil appears to move ahead of housing, but this timing is not stable enough to be used for forecasting.
Are Calgary home prices tied to oil prices?
There is a relationship, but it is indirect. Both oil prices and housing tend to respond to broader economic conditions rather than one directly driving the other.
Why don’t Calgary home prices fall as quickly as oil?
Oil is a highly volatile commodity, while housing adjusts more gradually. Factors like borrowing costs, supply, and buyer behavior tend to slow the pace of change in home prices.
Can you use oil prices to time the Calgary housing market?
No. Oil provides useful context for the broader economy, but it does not offer a reliable signal for timing purchases or sales in the housing market.
Does the oil and housing price relationship apply equally to every type of home in Calgary?
The data used for this analysis tracks the 'Total Residential' benchmark, which aggregates all property subtypes. While this captures the overall market cycle, individual segments—such as detached, semi-detached, row, and apartment homes—can behave differently depending on inventory levels, demand, and buyer preferences.
Considering a Move in Calgary?
Understanding how broader economic trends influence the market is helpful—but real estate decisions are ultimately driven by the inventory available in your specific neighborhood.
Buying: Local supply and demand conditions will tell you far more about your purchasing power than any single economic indicator.
Selling: Accurate pricing and positioning in today’s market matters more than trying to time external signals like oil volatility.
Explore current inventory and localized market insights for these featured communities:
- Arbour Lake: Real Estate & Community Guide
- Chinatown: Apartment Homes & Local Listings
- Mahogany: Row Homes & Market Overview
Want a city-wide view to today’s market?
Final Thought
Calgary home prices and oil prices are clearly connected, but not in a simple or mechanical way.
The relationship is real, but it is gradual, indirect, and influenced by a broader set of forces.
That is the main takeaway from the charts. Oil remains an important part of Calgary’s economic story. It just is not a stand-alone timing tool for the housing market.