
An analysis of Calgary residential sales from October 1, 2025, to September 30, 2026
Calgary has no single dominant kind of neighbourhood. In some parts of the city, two-storey homes account for most sales. Elsewhere, apartments, bungalows or split-level homes make up a much larger part of the market. Where you choose to buy can shape not only the price you pay, but also the layout of the homes you are likely to find.
To see how those differences play out, I examined 20,790 completed Calgary residential sales over the 12 months ending September 30, 2026. The analysis includes detached, semi-detached, row/townhouse and apartment properties. It compares how frequently different home configurations sold, where transactions were concentrated and what those patterns might mean for buyers and sellers.
The main result: two-storey homes accounted for 47.4% of the sales analysed. But the citywide number hides some striking geographic differences.
In everyday conversation, architectural style may mean the appearance of a home—Craftsman, Tudor or contemporary, for example. In the listing data used here, the ArchitecturalStyle field mostly describes a home's physical layout and configuration: two-storey, bungalow, bi-level, split-level or an apartment layout.
That is different from property subtype. A detached house, a semi-detached home and a row/townhouse can all be two-storey properties. Conversely, not every detached home is two-storey.
Some listing values combine configuration with an attachment description. For readability, the analysis groups related original labels into broader configuration categories—for instance, standard two-storey and two-storey attached side-by-side—while preserving each original MLS value in the underlying research. Categories that do not clearly identify a storey configuration are not forced into one.
Across the four included property subtypes, the six leading configurations were:
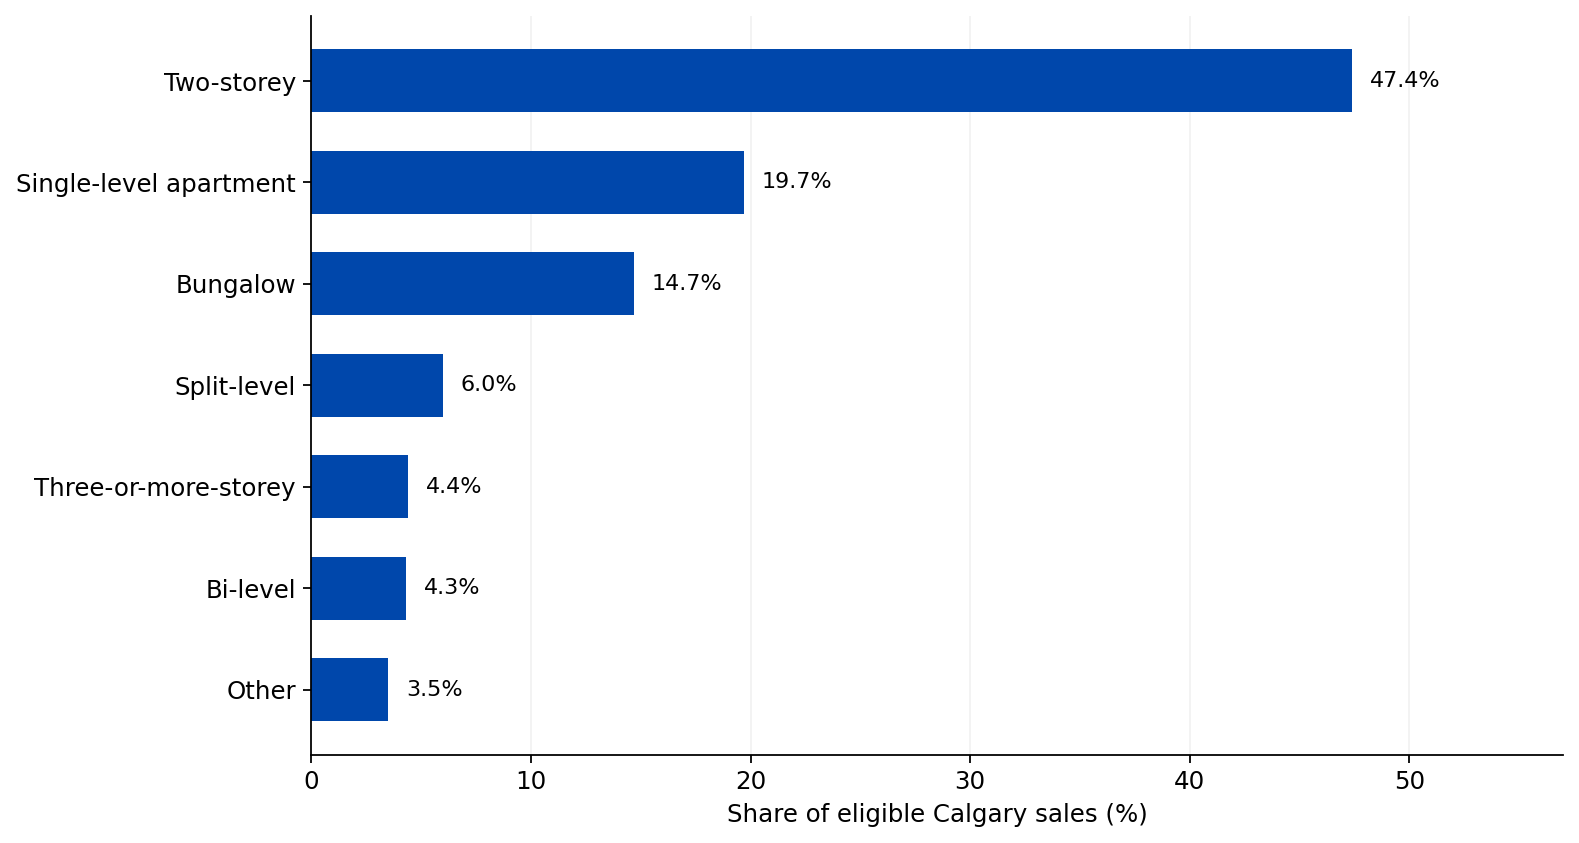
| Home configuration | Completed sales | Share of analysed sales |
|---|---|---|
| Two-storey | 9,846 | 47.4% |
| Single-level apartment | 4,092 | 19.7% |
| Bungalow | 3,063 | 14.7% |
| Split-level | 1,256 | 6.0% |
| Three-or-more-storey | 913 | 4.4% |
| Bi-level | 885 | 4.3% |
| Other configurations | 735 | 3.5% |
| Total | 20,790 | 100% |
Two-storey properties generated nearly half of the year's transactions. Single-level apartments ranked second, followed by bungalows. Together, these three configurations accounted for about 81.8% of the sales analysed.
These figures describe what sold, not necessarily what buyers most strongly preferred. A style can have many sales because many homes of that configuration exist. Measuring demand relative to supply would require a separate inventory analysis.
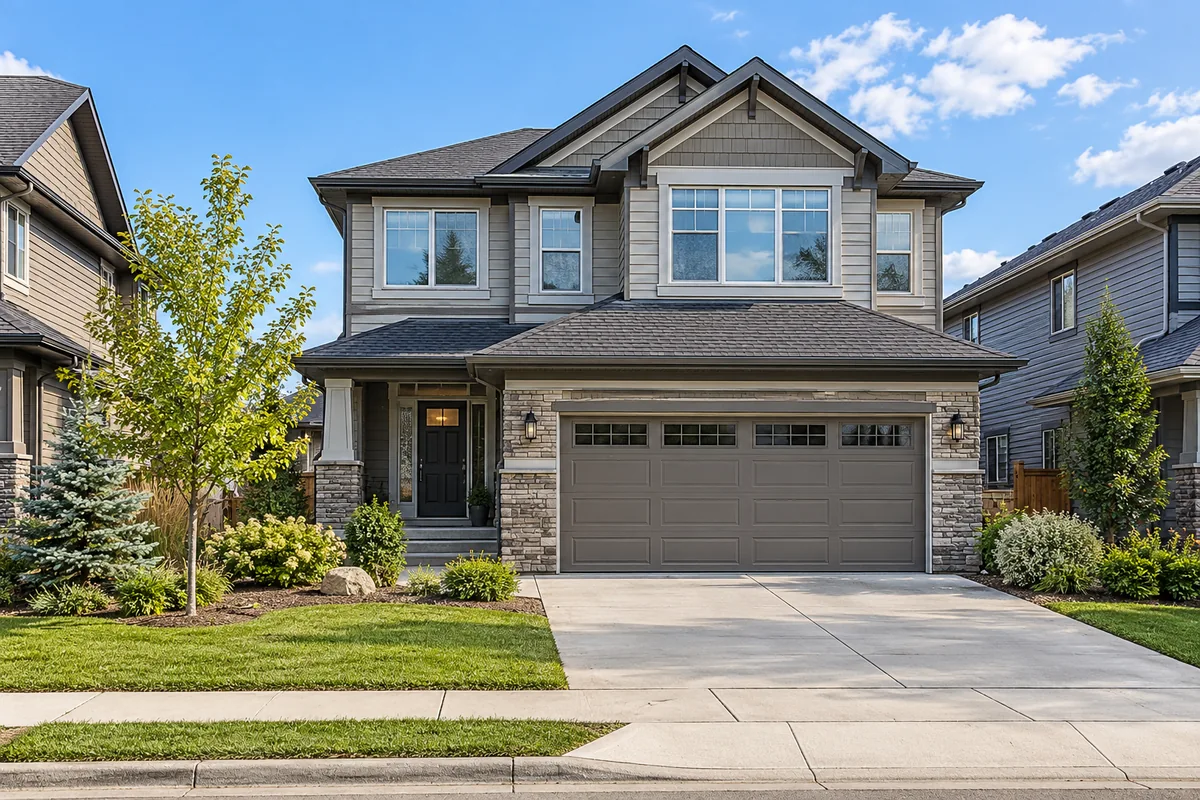
Living areas typically occupy the main floor, with additional rooms on a full upper floor. These can be detached, semi-detached or row homes.
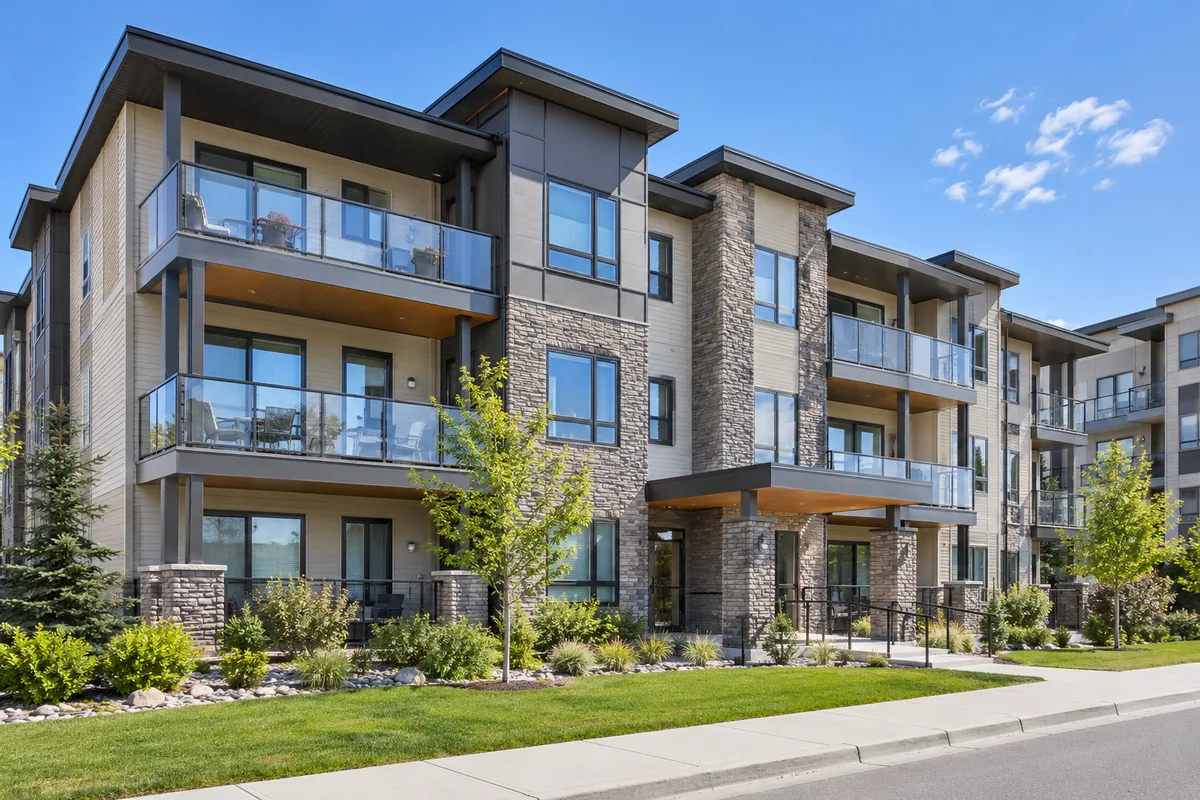
An apartment unit whose principal living area occupies one level within a larger building. Building height and condominium arrangements can vary.
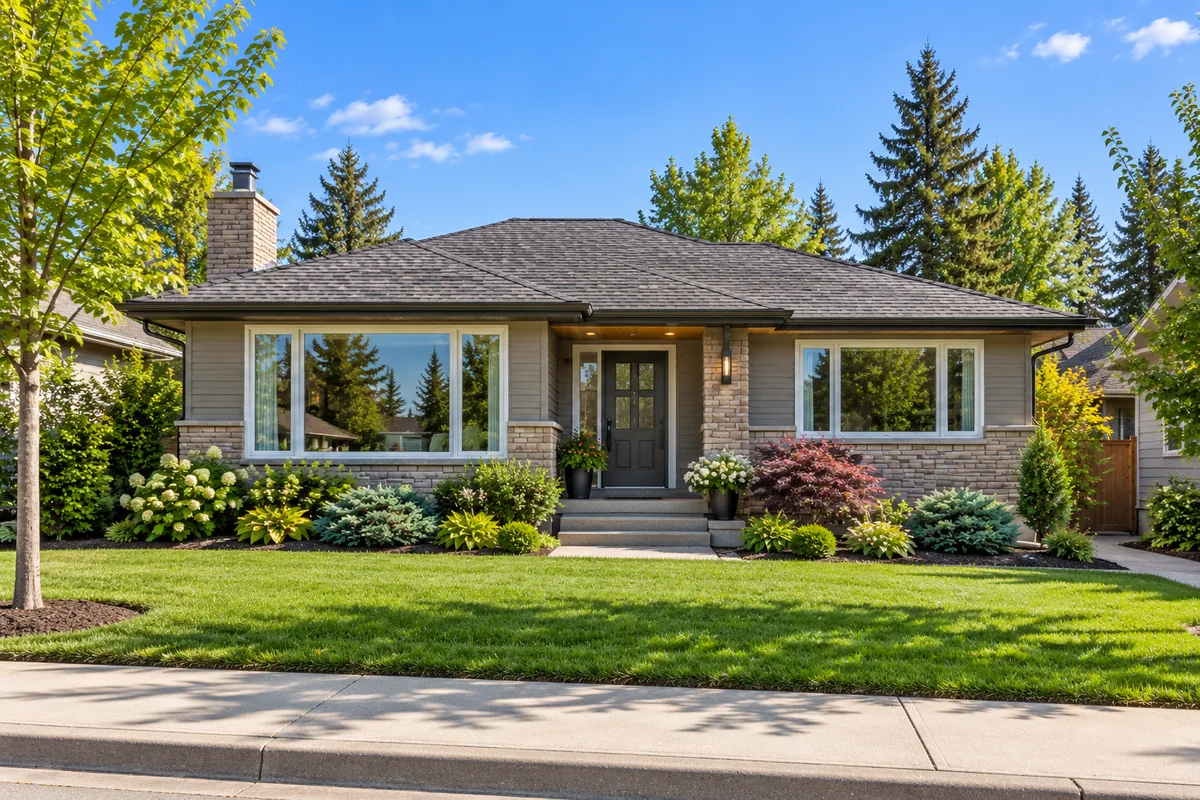
A home organized principally around one main above-grade level, often with a basement. Bungalows are not necessarily detached.
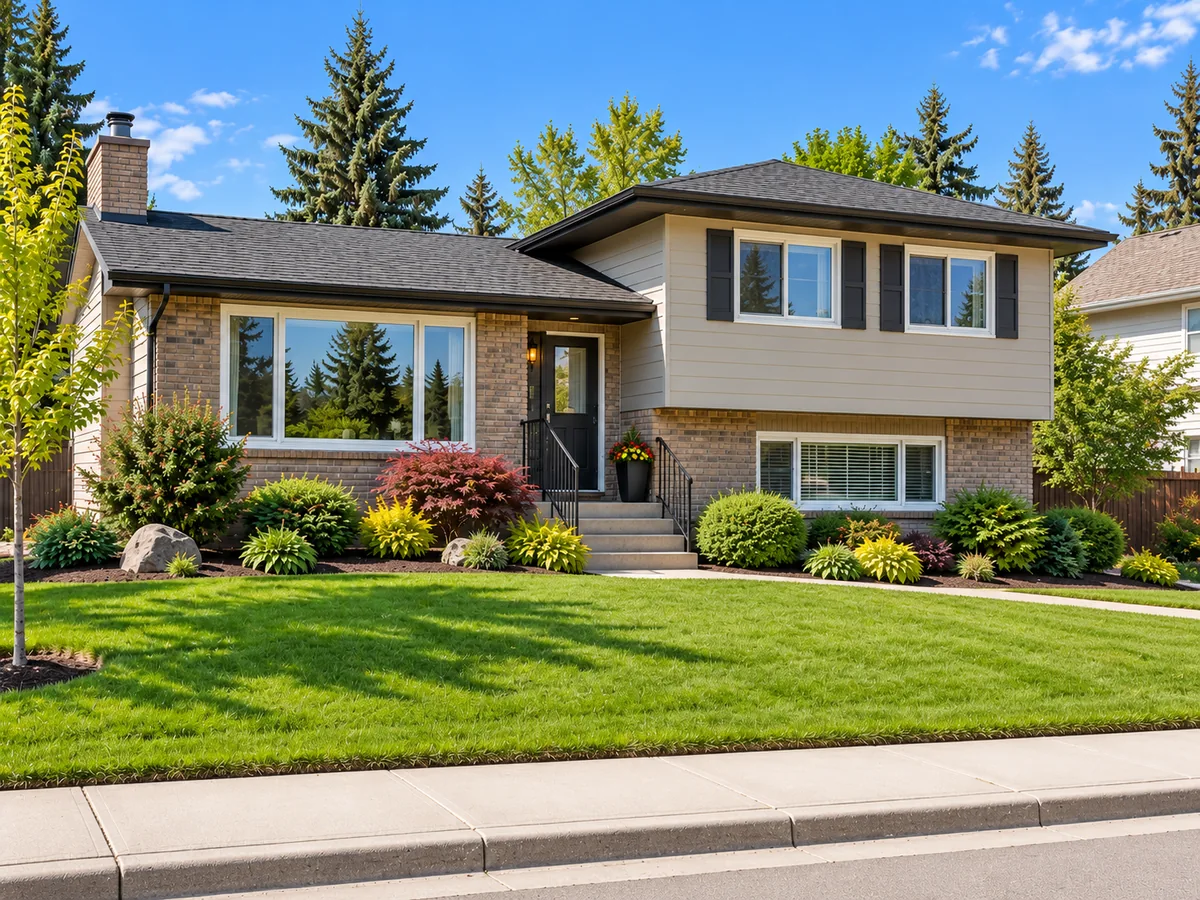
A home with living areas on staggered levels joined by shorter stair runs. The grouped category includes several distinct MLS split-level labels.
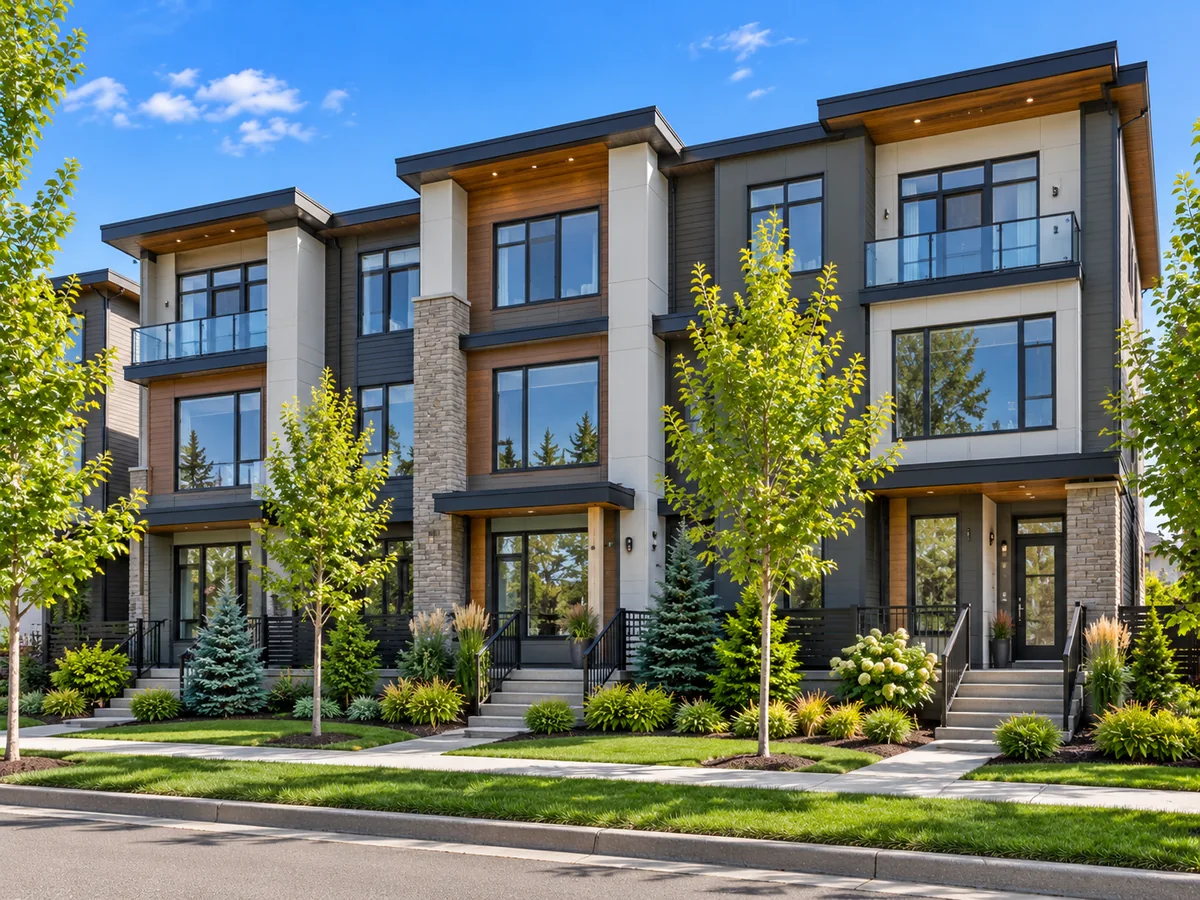
A multi-storey configuration, often found among row/townhouses, though not exclusively.
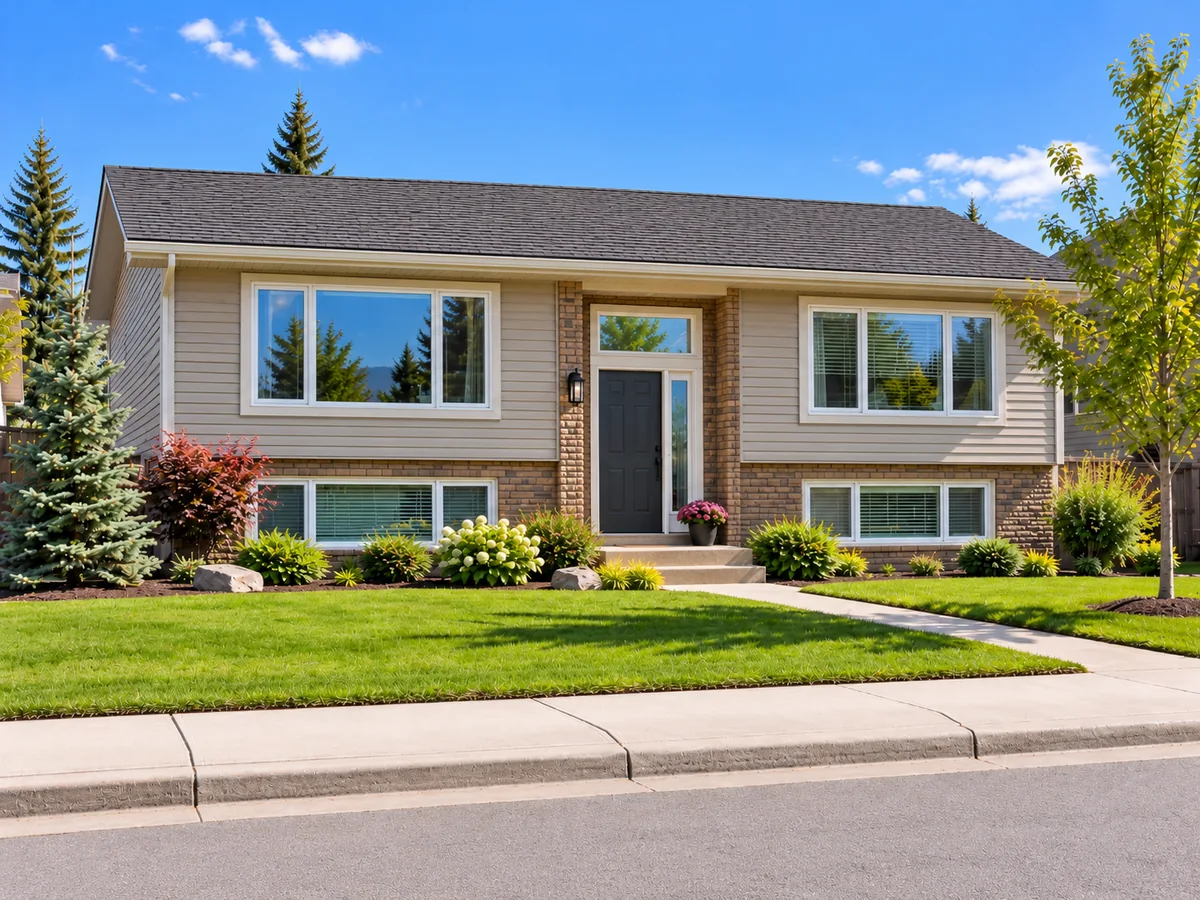
A home with the entrance commonly positioned between the main and lower levels, reached by shorter flights of stairs.
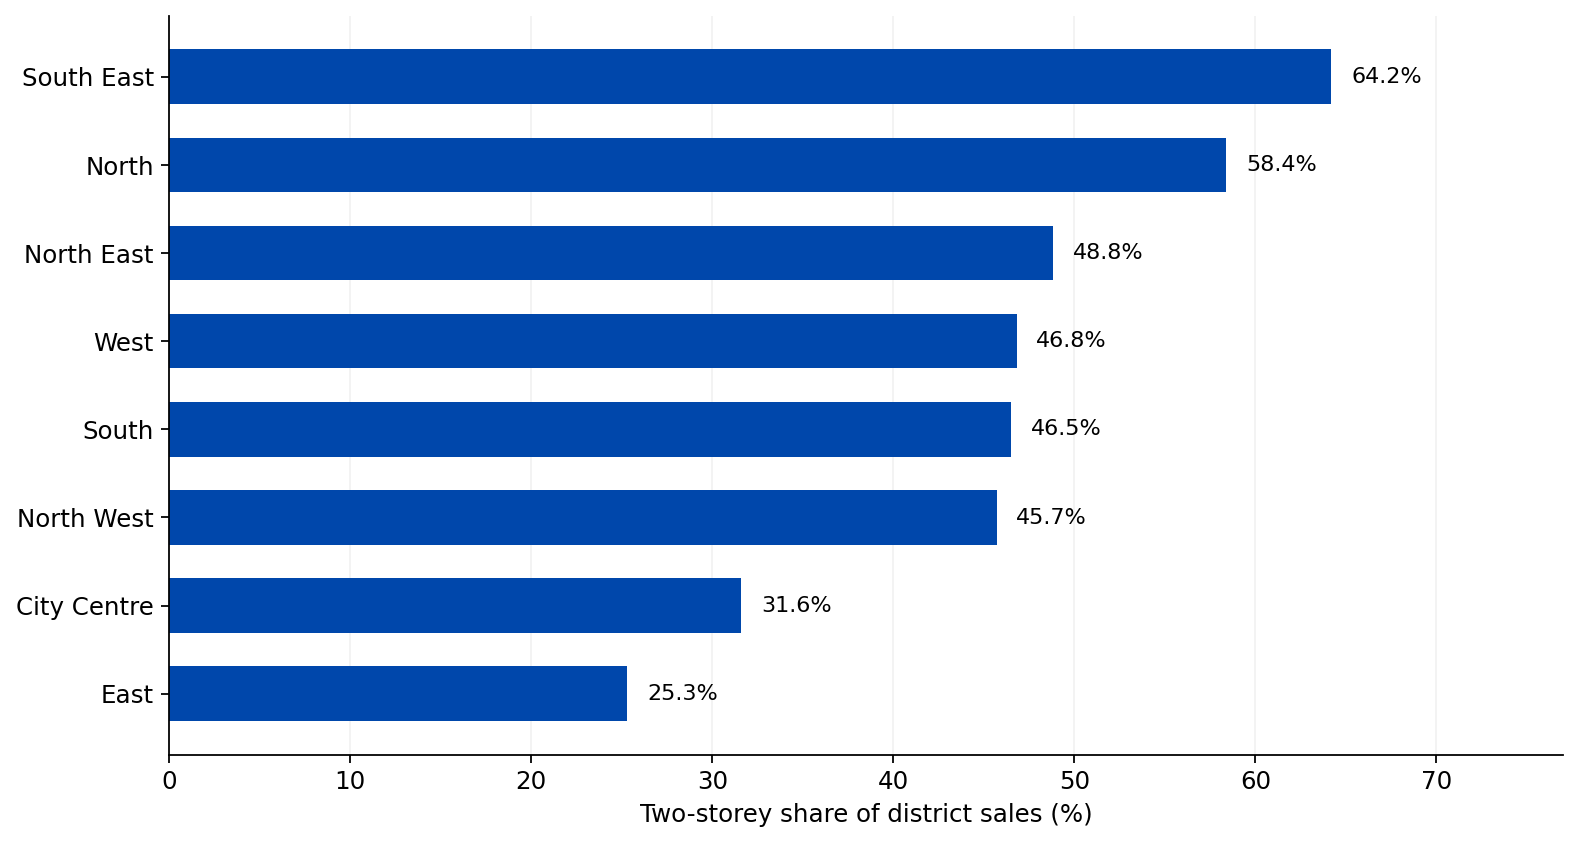
The citywide ranking becomes more revealing when sales are separated by district.
| Calgary district | Leading configuration | Share of district sales |
|---|---|---|
| City Centre | Single-level apartment | 41.2% |
| East | Bungalow | 33.2% |
| North | Two-storey | 58.4% |
| North East | Two-storey | 48.8% |
| North West | Two-storey | 45.7% |
| South | Two-storey | 46.5% |
| South East | Two-storey | 64.2% |
| West | Two-storey | 46.8% |
In the South East, two-storey homes accounted for 2,014 of 3,139 sales (64.2%). The North also had a pronounced two-storey profile, at 1,559 of 2,670 sales (58.4%).
The City Centre was different. Single-level apartments led at 1,636 of 3,972 sales (41.2%), reflecting a transaction mix unlike much of suburban Calgary. In the East, bungalows were the most frequently sold configuration, accounting for 205 of 617 sales (33.2%).
None of these shares represents the percentage of homes standing in a district. They are percentages of eligible completed sales during the 12-month study period.
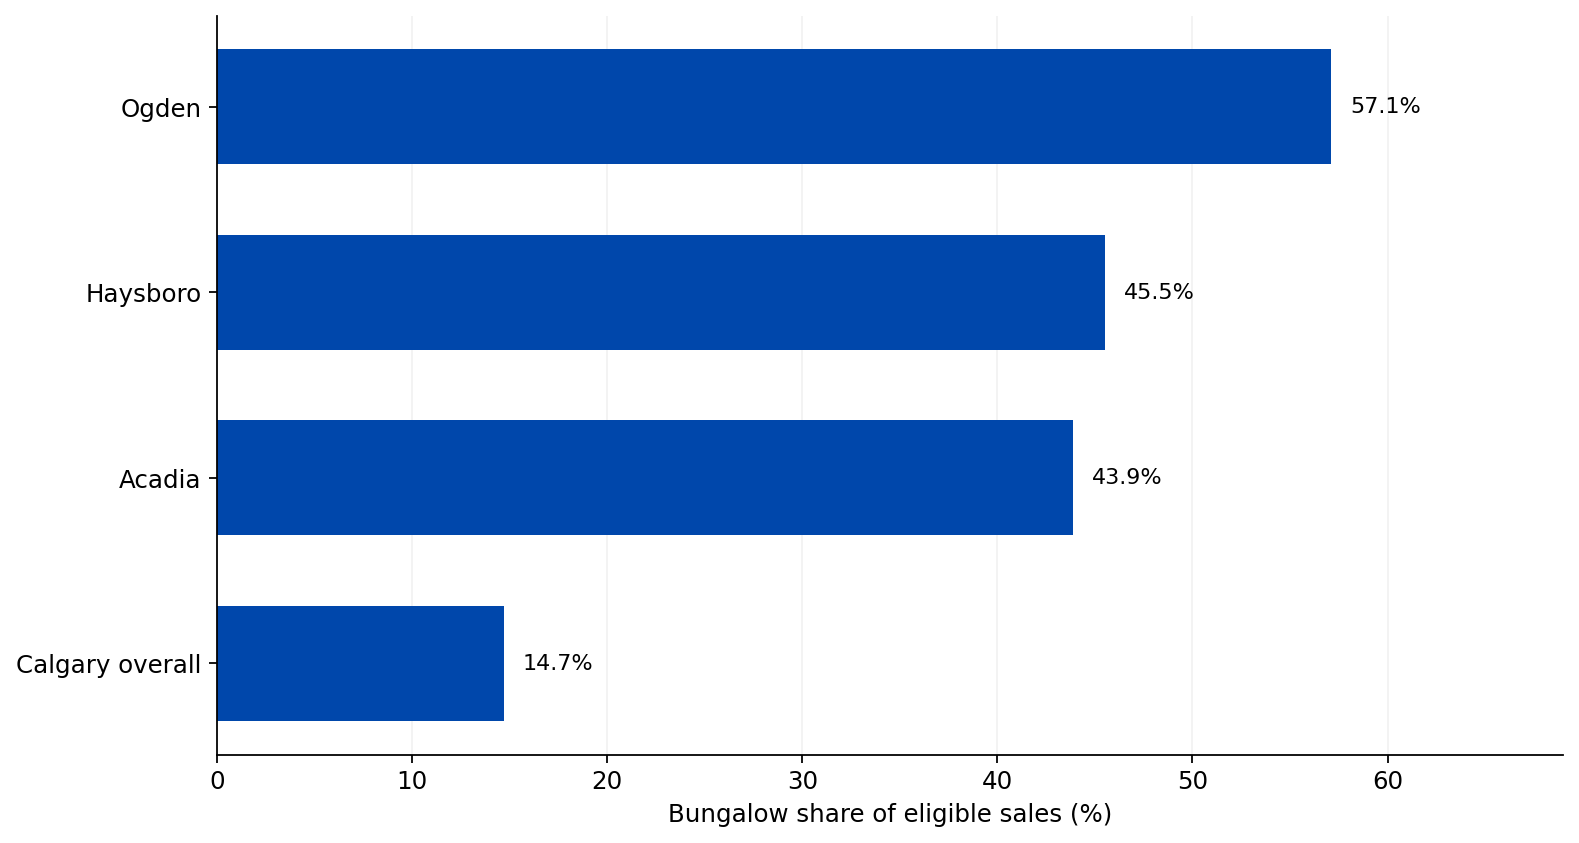
Buyers looking for bungalow layouts may find the community-level results particularly useful. Among communities meeting the analysis screen of at least 100 eligible sales overall and at least 20 bungalow sales, several had bungalow shares far above the 14.7% Calgary-wide average.
| Community | Bungalow sales | All eligible community sales | Bungalow share |
|---|---|---|---|
| Ogden | 60 | 105 | 57.1% |
| Haysboro | 55 | 121 | 45.5% |
| Acadia | 65 | 148 | 43.9% |
In Ogden, more than half of the eligible homes sold during the period were bungalows. In Haysboro and Acadia, the proportions were also well above the citywide share.
For a buyer whose priority is a single-main-floor layout, these communities may be worth investigating. But a high historical sales share does not guarantee that bungalows are available there today, or that they will suit a particular budget, size requirement or renovation plan.
The opposite pattern can be useful too. Mahogany recorded 297 two-storey sales, while Cranston recorded 256—substantial numbers for buyers researching locations where two-storey transactions are common. Large transaction totals should not be mistaken for unusually high proportions without checking the community denominator.
There is another important reason to look beneath the citywide figures: architectural configuration and property subtype are not interchangeable.
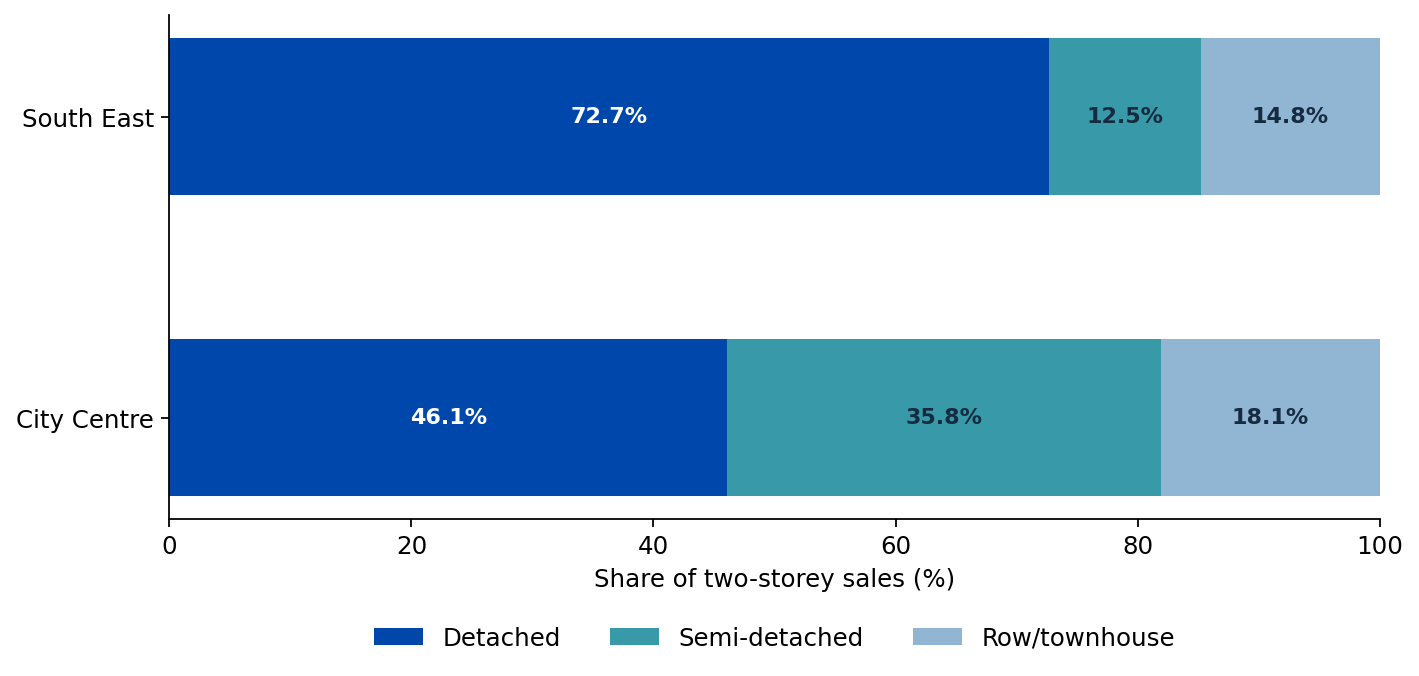
Consider two-storey transactions in two districts:
| Property subtype within two-storey sales | South East | City Centre |
|---|---|---|
| Detached | 1,464 | 578 |
| Semi-detached | 252 | 449 |
| Row/townhouse | 298 | 227 |
| All two-storey sales | 2,014 | 1,254 |
| Detached share of two-storey sales | 72.7% | 46.1% |
In the South East, roughly three-quarters of two-storey sales were detached homes. In City Centre, less than half were detached, with semi-detached homes contributing a much larger proportion.
This matters when comparing homes and interpreting market statistics. A seller of a two-storey semi-detached home should not treat every two-storey detached sale as an equivalent comparable simply because the configuration label matches.
Home configuration is associated with some interesting differences in the sales data, but these comparisons need care.
| Configuration | Median sold price | Median days on market |
|---|---|---|
| Two-storey | $663,500 | 28 |
| Single-level apartment | $295,000 | 38 |
| Bungalow | $651,500 | 20 |
| Split-level | $600,000 | 22 |
| Three-or-more-storey | $487,500 | 36 |
| Bi-level | $535,000 | 23 |
Bungalows and two-storey properties had fairly close citywide median sold prices: $651,500 and $663,500 respectively. Yet once the comparison is limited to detached properties, the medians were $671,000 for bungalows and $722,600 for two-storey homes. These homes also differed substantially in median recorded living area: 1,156 square feet for detached bungalows versus 1,975 square feet for detached two-storey properties.
That is a reason to look more closely at neighbourhood, lot characteristics, age and the condition of individual homes—not evidence that the bungalow configuration itself adds a particular dollar premium.
Single-level apartments had a longer median marketing period (38 days) than bungalows (20 days). But that does not prove buyers prefer one configuration over the other: these sales occur in very different property markets, locations and price ranges.
Start with the layout you need, then examine the communities where that layout appears regularly in completed sales. A buyer wanting fewer stairs may discover useful options in communities with substantial bungalow activity. Someone seeking a two-storey layout can compare a broader range of neighbourhoods—but should decide whether detached, semi-detached or row housing best fits their requirements.
Think beyond the label. A split-level, bi-level and two-storey property can distribute living space quite differently. Stairs, basement development, floor area, accessibility and future renovation plans may be more important than the category itself.
Finally, treat these results as a guide to where to investigate, not a substitute for current listings. The available selection and pricing can change quickly.
A useful competitive analysis starts with homes that buyers would regard as realistic alternatives. Architectural style is one part of that comparison, not the entire comparison. Subtype, community, size, age, condition, lot attributes and renovations all matter.
The district data shows why a citywide statistic may not be a good guide to an individual property. A two-storey detached home in the South East participates in a different mix of competing properties from a two-storey semi-detached home in City Centre. Likewise, a bungalow seller in Acadia should begin with relevant local bungalow comparables, not only Calgary-wide medians.
Historical sales patterns also do not tell a seller how many similar properties are actively competing today. A current market analysis remains necessary to evaluate pricing and timing.
During the 12 months ending September 30, 2026, two-storey properties accounted for 47.4% of the 20,790 eligible Calgary sales analysed. Yet that single statistic masks significant differences: the South East and North were strongly two-storey-oriented, City Centre sales included a large share of single-level apartments, and bungalows were unusually prominent in parts of the East and several established communities.
For buyers, those differences can help focus a neighbourhood search. For sellers, they are a reminder to compare homes within the right local and property-subtype context. Calgary's market is not one uniform collection of houses—and architectural configuration is one useful way to understand its variety.
Explore Calgary homes and communities. Browse the Calgary communities hub or review the latest Calgary market report for current market context.
This article is based on an analysis of the supplied Calgary MLS listing-data export, covering records marked sold with closing dates from October 1, 2025 through September 30, 2026. It includes only the PropertySubType values Detached, Semi Detached (Half Duplex), Row/Townhouse and Apartment, for 20,790 eligible transactions.
The original ArchitecturalStyle field contains more specific and compound labels; these were preserved and mapped to a documented set of broader configurations for reporting. The reported counts are transactions in the supplied export, not an independently audited census of all Calgary sales. Medians are unadjusted descriptive statistics, not estimates of price effects attributable to architectural style. Community highlights were screened using at least 100 total eligible transactions and 20 style-specific transactions during the study period.