
A sale-to-list price near 98% sounds straightforward: if a Calgary home sells for 98% of its asking price, it is tempting to conclude that the seller gave up roughly 2%.
But that interpretation can miss an important step in the listing history.
CREB® reported a city-wide 97.53% Sales to List Price measure for August 2026 and 97.97% year to date. Those figures are useful measures of how sale prices compare with asking prices at the time of sale. They do not, by themselves, show whether the asking price had already been reduced earlier in the listing. See the CREB® August 2026 City of Calgary statistics package.
I analyzed 20,928 Calgary residential sales closing between September 1, 2025 and August 31, 2026. The median sale price was 97.83% of the final asking price—very close to the familiar 98% headline.
But 7,160 of those sold listings, or 34.2%, had reduced their asking price before they sold.
34.2% of sold listings recorded a lower final asking price than their original asking price.
Reduced listings sold for a median 97.35% of their final asking price but only 93.02% of their original asking price.
The median Days on Market was 18 days for listings whose asking price was unchanged and 60 days for listings that were reduced.
Two Asking Prices Headline Results Size of Reduction Days on Market Property Types What It Means Methodology
The listing-level data contains two different price fields that matter for this question.
Original List Price is the asking price when that MLS® listing was created.
List Price is the asking price recorded on the sold listing after any price changes made within that listing.
If a home starts at $700,000, is reduced to $660,000 and eventually sells for $645,000, its sale price is:
The first number makes the sale look very close to asking. The second describes how far the eventual sale ended up from where the seller initially entered the market.
Neither number is wrong. They answer different questions.
| Measure | All Sold | Asking Price Unchanged | Asking Price Reduced | Asking Price Increased |
|---|---|---|---|---|
| Sold listings | 20,928 | 13,632 | 7,160 | 136 |
| Share of sales | 100% | 65.1% | 34.2% | 0.6% |
| Median sale / final asking price | 97.83% | 98.15% | 97.35% | 98.18% |
| Median sale / original asking price | 96.85% | 98.15% | 93.02% | 100.70% |
| Median Days on Market | 28 | 18 | 60 | 35.5 |
| Median recorded asking-price change | — | 0% | 4.04% reduction | 2.32% increase |
| Median dollar asking-price change | — | $0 | $21,800 reduction | $10,000 increase |
The overall median sale-to-final-list ratio of 97.83% looks fairly ordinary. The important difference appears when the sold listings are separated into three distinct price histories: asking price unchanged, asking price reduced, and asking price increased.
For 13,632 listings, or 65.1% of sales, the final asking price was exactly the same as the original asking price. For this group, the median sale-to-final-list and sale-to-original-list ratios are necessarily identical: 98.15%.
7,160 listings, or 34.2%, had a lower final asking price than their original asking price. For these reduced listings, the median sale remained close to the final asking price while ending much farther below the original asking price.
A small third group—136 listings, or 0.6% of sales—had a final asking price above the original asking price. They are shown separately in the headline table rather than being grouped with unchanged listings. Because a price increase is not part of the price-reduction sequence being studied, those 136 listings are excluded from the reduction-size charts and tables below.
This is the most revealing part of the analysis.
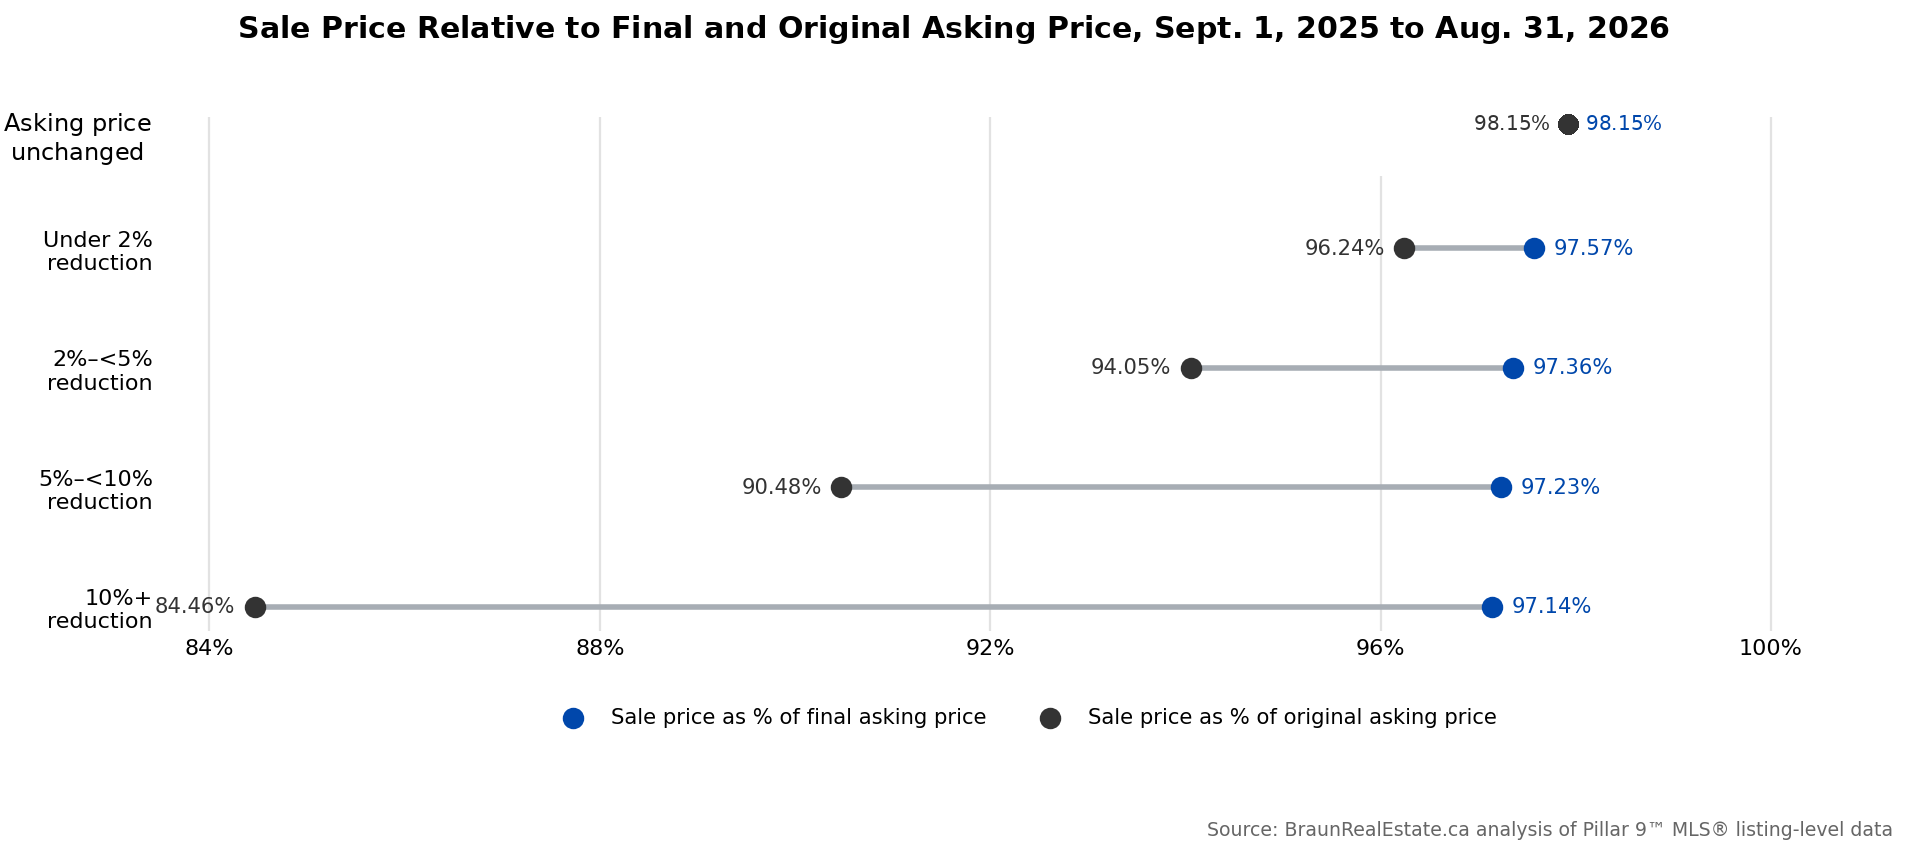
Among homes that eventually sold, I grouped listings by the size of the recorded reduction between the original and final asking prices. The final sale-to-list ratio stayed clustered around 97% to 98% even as the original-to-final price reduction became much larger.
| Recorded reduction before sale | Sold listings | Sale / final ask | Sale / original ask |
|---|---|---|---|
| Asking price unchanged | 13,632 | 98.15% | 98.15% |
| Under 2% | 1,146 | 97.57% | 96.24% |
| 2% to under 5% | 3,232 | 97.36% | 94.05% |
| 5% to under 10% | 2,105 | 97.23% | 90.48% |
| 10% or more | 677 | 97.14% | 84.46% |
For listings reduced by 10% or more, the eventual sale was still a median 97.14% of the final asking price. Looking only at that number could suggest a fairly normal negotiation.
Measured from the original asking price, however, the median sale was only 84.46%.
This is why a sale-to-list statistic should not automatically be interpreted as the seller's total concession from the price at which the property first entered the market.
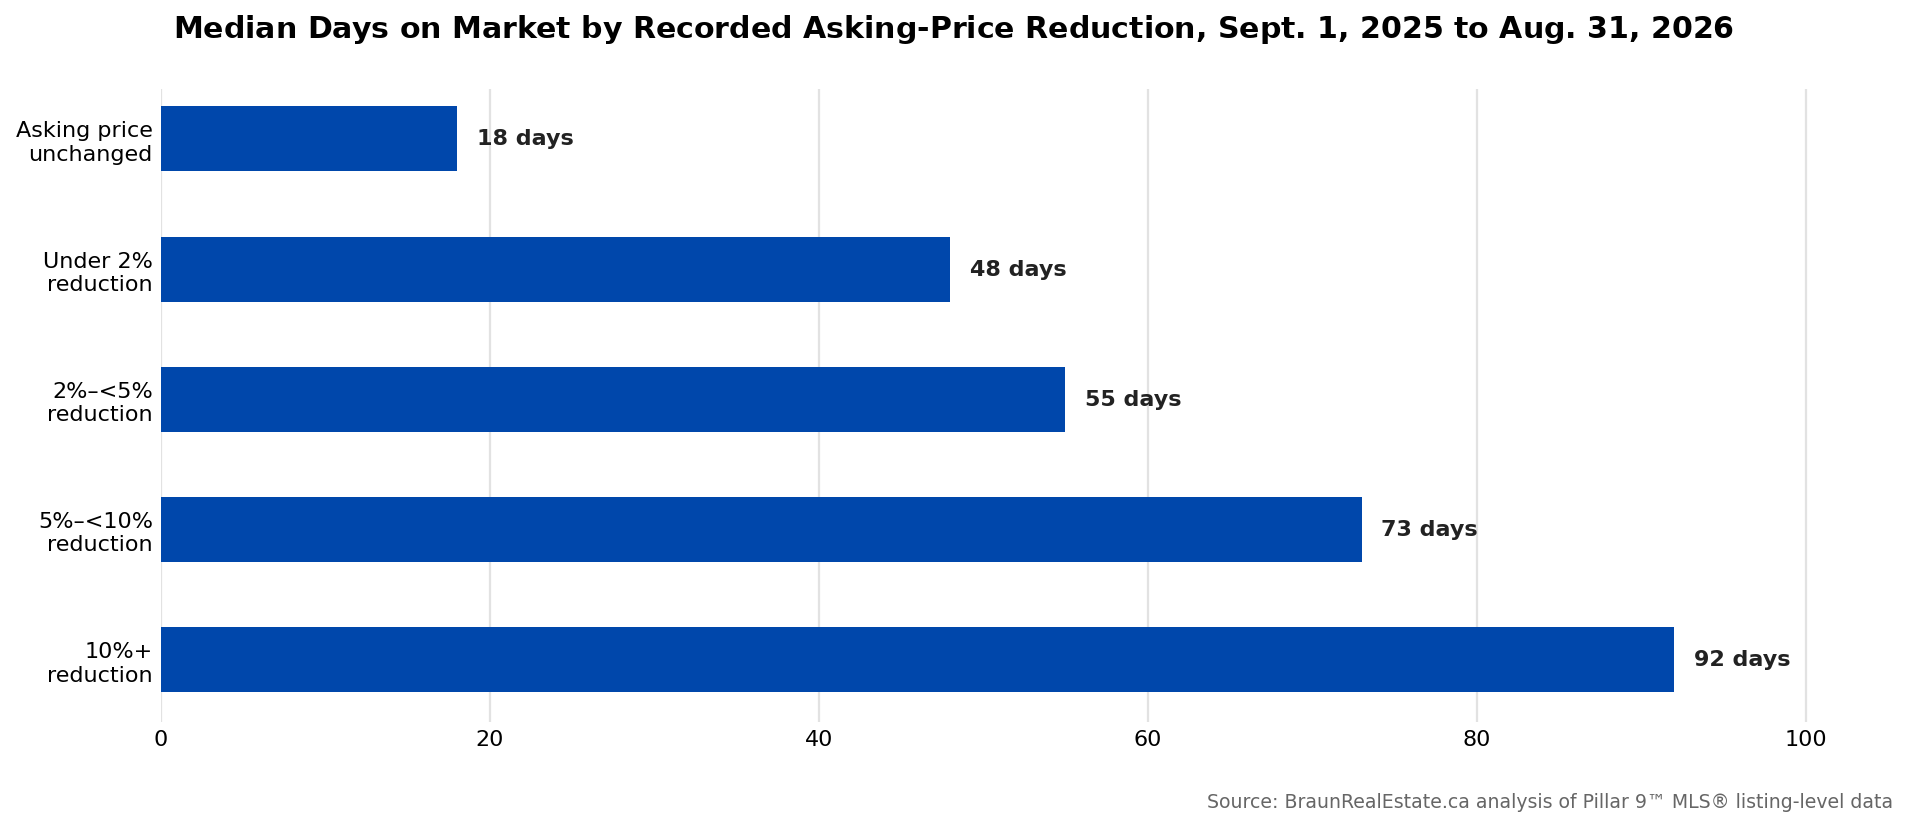
The same groups show a strong relationship with Days on Market among homes that ultimately sold.
| Recorded reduction before sale | Median Days on Market |
|---|---|
| Asking price unchanged | 18 |
| Under 2% | 48 |
| 2% to under 5% | 55 |
| 5% to under 10% | 73 |
| 10% or more | 92 |
The data does not establish that price reductions themselves caused the longer marketing periods or lower sale prices. Listings can be reduced because they were already struggling to attract a buyer at the earlier price.
The useful observation is the listing pathway: homes that ultimately required larger asking-price adjustments tended to have substantially longer marketing histories before they sold.
Recorded reductions were present across Calgary's major residential property types.
| Property type | Sold listings | Share reduced before sale | Median sale / final ask | Median sale / original ask |
|---|---|---|---|---|
| Detached | 10,969 | 31.5% | 98.11% | 97.32% |
| Semi-Detached | 2,113 | 32.0% | 98.11% | 97.30% |
| Row/Townhouse | 3,394 | 37.7% | 97.87% | 96.78% |
| Apartment | 4,389 | 39.5% | 96.99% | 95.47% |
Apartments and row homes had a higher share of sold listings with recorded price reductions than detached and semi-detached homes during the study period. That fits the broader 2026 market context: CREB® reported materially higher supply relative to sales in the apartment segment, with 5.68 months of supply in August compared with 3.39 for detached homes.
The purpose here is not to claim that property type alone determines whether a seller will need to reduce. Price range, community, condition, competition, timing and the initial pricing decision all matter.
A sale-to-list ratio near 98% should not be read as proof that sellers who start high typically give up only 2%. The final asking price may already reflect weeks of market feedback and one or more price adjustments.
For pricing decisions, the more useful comparison is not simply what recent homes sold for relative to their final list price. It is also worth examining where those listings started, whether they reduced, how long they were exposed to the market, and what competing inventory buyers could choose from at the time.
A property's final asking price also does not reveal its entire negotiating history. A listing that appears to have sold only 2% below asking may have already moved substantially from its original price before an offer was accepted.
That does not automatically mean there is more room for another reduction. It means the final sale-to-list percentage is only one part of the pricing history.
Want to see the broader Calgary market context? Review the latest Calgary market reports for sales, inventory, Months of Supply and price trends by property type and district.
This analysis uses Pillar 9™ MLS® listing-level data supplied for Calgary residential properties.
The primary study population is 20,928 sold listings with closing dates from September 1, 2025 through August 31, 2026 and positive values for Original List Price, List Price and Close Price.
The calculations are:
Medians are used for ratios, dollar reductions and Days on Market because the distributions contain outliers and are not well summarized by a simple average.
Of the 20,928 sold listings, 13,632 had an unchanged asking price, 7,160 had a reduction, and 136 had an increase. The 136 price increases are reported separately in the headline results. They are excluded from the reduction-size charts and tables because they do not belong to a price-reduction category.
As a data-quality check, eight records had a final-to-original list-price ratio below 0.50 or above 2.00, consistent with obvious price-entry anomalies. Excluding those records does not change any headline result at the precision shown in this article.
Important limitation: the unit of analysis is the MLS® listing, not a complete property marketing history. If a listing expires or terminates and the property is subsequently entered as a new MLS® listing, the new record receives a new Original List Price. This analysis therefore identifies price reductions recorded within the successful listing and does not carry the asking price from an earlier listing into a later one.
The official CREB® August 2026 statistics are used only as broader market context and are methodologically separate from the BraunRealEstate.ca listing-level calculations. In August, CREB® reported 1,660 Calgary sales, 6,509 units of inventory and 3.92 months of supply, with a city-wide Sales to List Price measure of 97.53%.
Data is deemed reliable but is not guaranteed accurate. The trademarks MLS®, Multiple Listing Service® and the associated logos are owned by The Canadian Real Estate Association (CREA) and identify the quality of services provided by real estate professionals who are members of CREA. Used under license.
Calgary homes in this 12-month sample sold for a median 97.83% of their final asking price.
That number is useful. But on its own, it can make the gap between a seller's expectations and the eventual sale look smaller than it really was.
More than one in three sold listings had already reduced the asking price. Among those listings, the median sale was 97.35% of the final asking price but only 93.02% of the original asking price.
The practical takeaway is simple: when evaluating pricing performance, look at both the final asking price and where the listing started.