
Calgary's residential market remained balanced in June 2026, with 3.09 months of supply and a benchmark price of $572,500. The city-wide result masks a widening split: detached and semi-detached homes remained comparatively resilient, while apartment condominiums and several higher-supply districts offered buyers substantially more choice. This report explains the trend, the divergence, and the practical implications.
Executive Summary
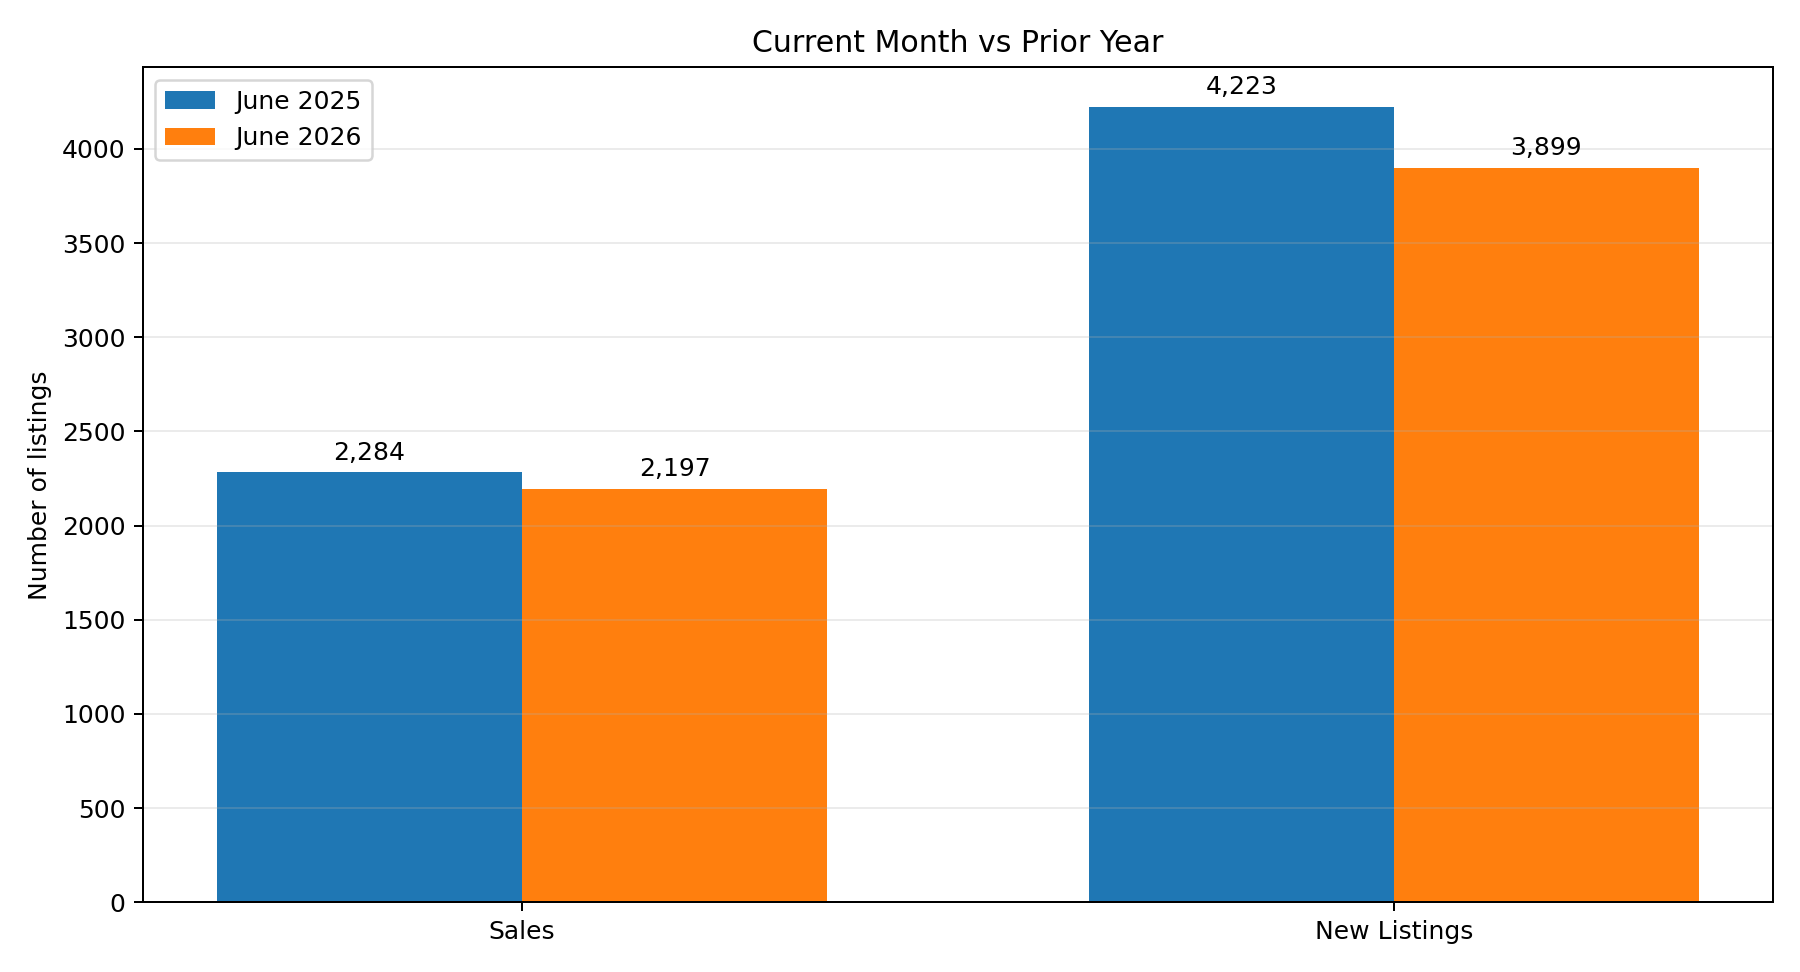
Calgary entered the summer with a balanced city-wide market, but the balance was not uniform. Official June statistics show sales down 3.8% from a year earlier, new listings down 7.7%, inventory down 2.1%, and months of supply edging up to 3.09. The benchmark price was $572,500, 2.1% below June 2025. Taken together, those figures describe a market with adequate choice and less upward price pressure than a year ago, rather than a city-wide buyer's or seller's market.
The more important finding is divergence. Listing-level analysis shows apartment sales fell about 20% year over year while active apartment supply increased, producing materially softer conditions than in detached and semi-detached segments. Detached sales were essentially unchanged and active supply was slightly lower, while semi-detached sales increased and row-home conditions sat between those two extremes. Geographic differences followed the same pattern: North East, City Centre, and East had more than four months of supply, while South, West, South East, North West, and North remained closer to balanced conditions.
For buyers, negotiating leverage depends increasingly on segment and location. For sellers, accurate pricing and direct competition matter more than the city-wide headline. The next signal to watch is whether late-summer inventory falls quickly enough to stabilize apartment and higher-supply district conditions, or whether slower demand keeps those segments buyer-favouring.
Calgary Market at a Glance
Official city-wide dashboard values: CREB® City of Calgary Monthly Statistics Package, June 2026.
How Market Conditions Are Changing
Calgary's market became modestly less competitive over the past year, although the latest month did not represent a sharp city-wide deterioration. Official months of supply increased from 3.04 in June 2025 to 3.09 in June 2026, keeping the market inside the balanced range. Sales declined 3.8%, but new listings fell by a larger 7.7% and inventory was 2.1% lower. That combination limited the increase in supply relative to demand.
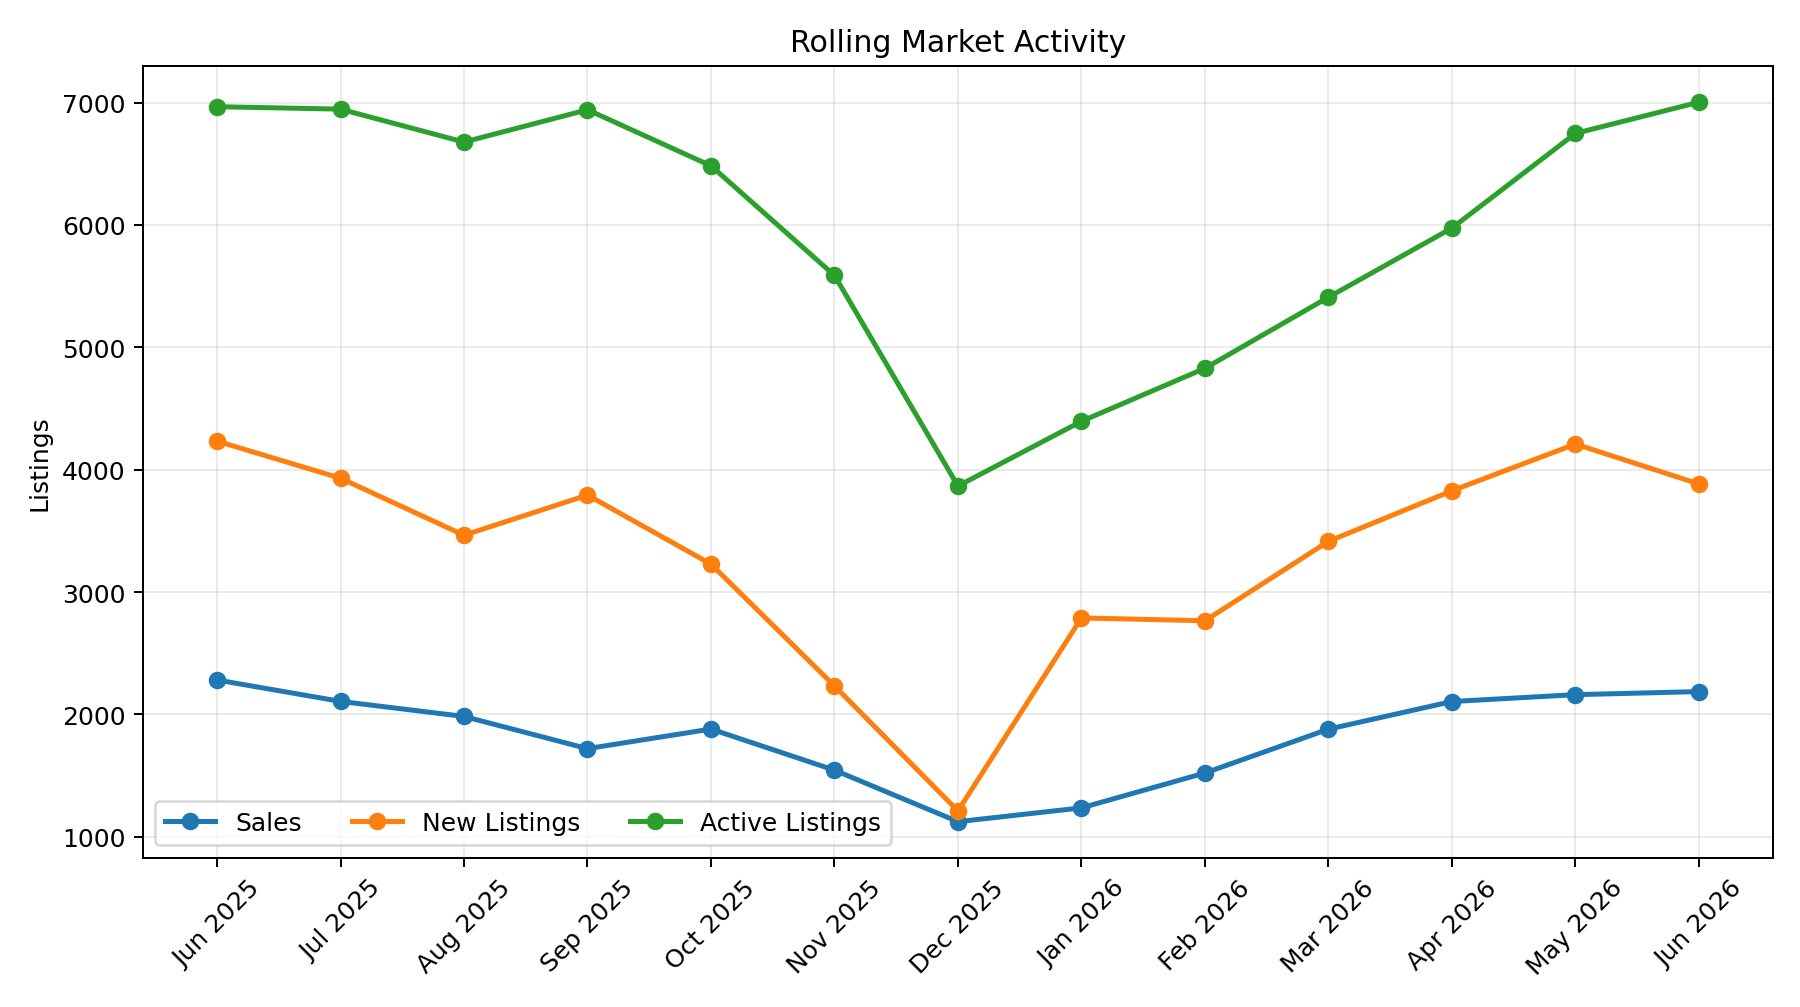
The rolling listing-level series shows the normal seasonal rebuilding of inventory from the winter low. Active and pending listings rose from approximately 3,900 at the end of December to about 7,000 at the end of June. Sales also recovered through spring, increasing from roughly 1,200 in January to more than 2,100 in each of May and June. New listings peaked in May before easing in June. The change is therefore best described as a seasonal expansion in choice accompanied by stable spring sales, not a collapse in demand.
Compared with June 2025, however, the market is less uniformly competitive. The city benchmark price declined 2.1%, days on market increased, and the sales-to-list-price ratio eased. Those movements are consistent with a market where buyers have more time and more alternatives than during the strongest seller-market periods. The city-wide market remains balanced, but the direction over the past year has been toward greater buyer choice.
Where the Market Is Diverging
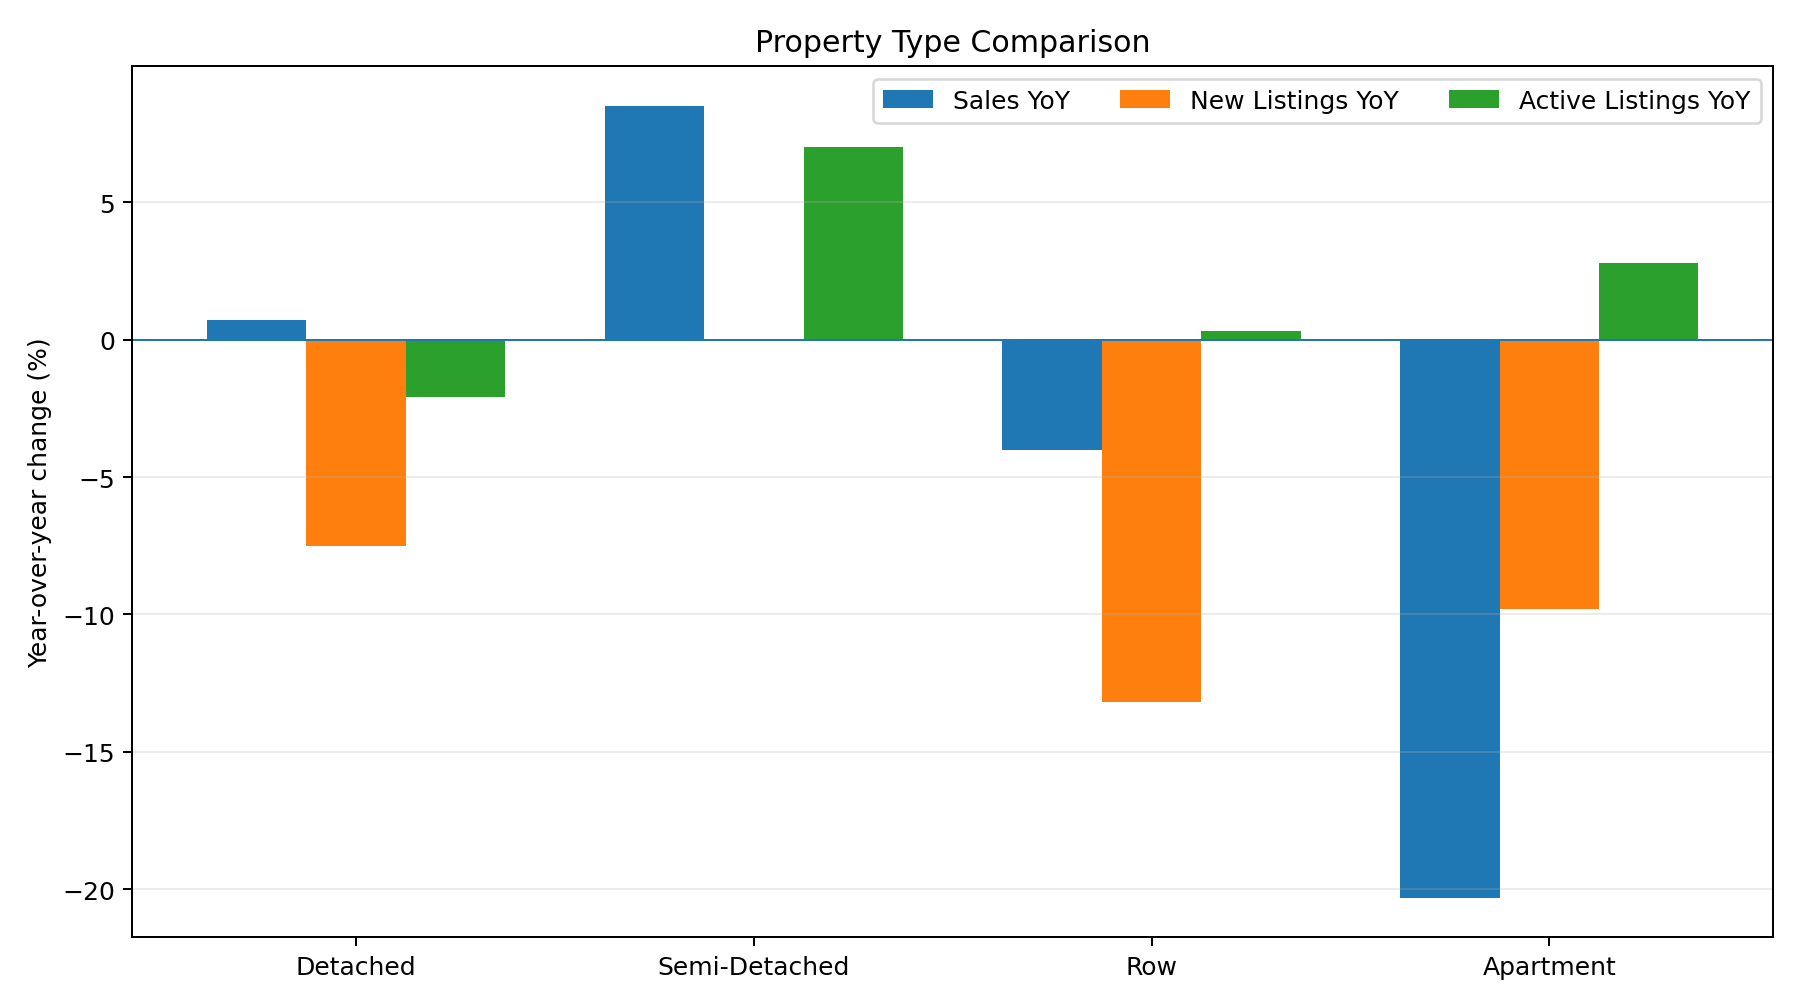
Property type is the clearest dividing line. Apartment condominium sales were approximately 20% lower than in June 2025, while active apartment listings were about 3% higher. New apartment listings declined, but not enough to offset the weaker sales pace. The official CREB segment statistics reinforce the same conclusion: apartment months of supply rose to 4.91 and the benchmark price fell 9.0% year over year.
Detached homes were considerably more resilient. Listing-level detached sales were broadly unchanged from a year earlier, new listings declined, and active supply was slightly lower. Official detached months of supply was 2.49, near the boundary between a seller's and balanced market, and the benchmark price declined only 1.4%. Semi-detached sales increased in the listing-level data, although active supply also rose; official months of supply remained 2.50 and the benchmark price was essentially unchanged year over year.
Row homes occupied the middle ground. Sales and new listings were lower than a year earlier while active supply was almost unchanged. Official months of supply was 3.41 and the benchmark price was down 5.6%. This segment was softer than detached and semi-detached homes, but did not show the same degree of excess supply and price pressure as apartments.
The practical conclusion is that a single city-wide label is not sufficient. Calgary was balanced overall, yet conditions ranged from relatively competitive low-rise segments to buyer-favouring apartment submarkets. The divergence is supported by sales, supply, months of supply, and price evidence rather than by any single indicator.
| Property Type | Sales YoY | New Listings YoY | Active Listings YoY |
|---|---|---|---|
| Detached | +0.7% | -7.5% | -2.1% |
| Semi-Detached | +8.5% | +0.0% | +7.0% |
| Row | -4.0% | -13.2% | +0.3% |
| Apartment | -20.3% | -9.8% | +2.8% |
Geographic Differences
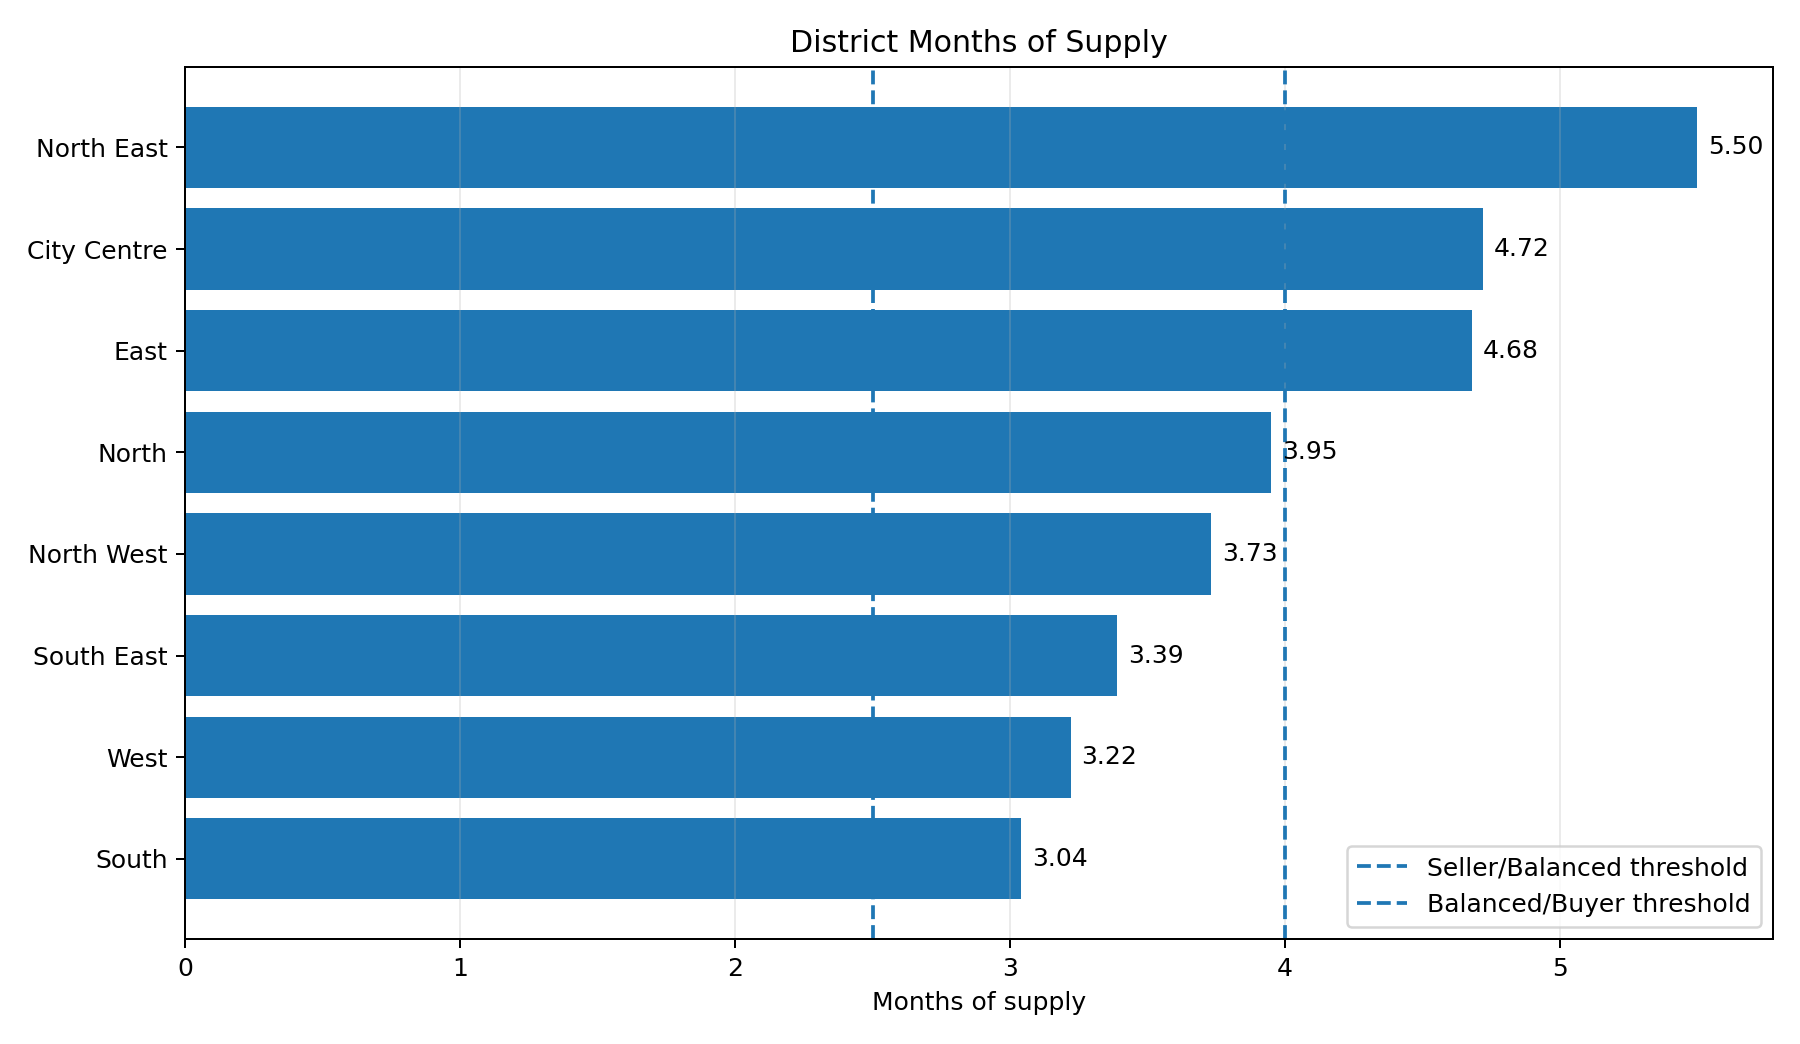
District analysis shows that higher supply was concentrated in specific parts of Calgary. Using active and pending month-end listings divided by the trailing 12-month sales rate, North East recorded about 5.50 months of supply. City Centre and East were also above the buyer-market threshold at approximately 4.72 and 4.68 months respectively. These districts offered the greatest overall buyer choice.
North was close to the upper edge of balance at 3.95 months, while North West, South East, West, and South ranged from approximately 3.04 to 3.73 months. These districts were balanced by the framework thresholds. None of the district totals fell below 2.5 months, although individual property-type and community markets within them may still have been more competitive.
The geographic pattern partly reflects housing mix. City Centre includes a large apartment inventory, and apartment conditions were the softest property-type segment. North East and East also carried higher supply relative to their trailing sales rates. By contrast, districts with a larger share of lower-supply detached and semi-detached activity generally remained closer to balance. District figures should therefore be read as broad context rather than as substitutes for property-type or community-level analysis.
| District | Months of Supply | Market State |
|---|---|---|
| North East | 5.50 | Buyer's Market |
| City Centre | 4.72 | Buyer's Market |
| East | 4.68 | Buyer's Market |
| North | 3.95 | Balanced Market |
| North West | 3.73 | Balanced Market |
| South East | 3.39 | Balanced Market |
| West | 3.22 | Balanced Market |
| South | 3.04 | Balanced Market |
What Is Driving the Market
The market's behaviour is best explained by the relationship between supply composition and demand. City-wide inventory was slightly lower than a year ago, but that total concealed where listings accumulated. Supply was concentrated in apartments and in districts with a meaningful condominium component, while detached inventory remained comparatively constrained. The result was balanced total supply alongside materially different competitive conditions by segment.
Demand also shifted unevenly. Detached sales held close to last year's level and semi-detached sales improved in the listing-level data, while apartment sales declined sharply. Because apartment supply did not contract at the same pace, months of supply increased and sellers faced more direct competition. This relationship is consistent with the larger apartment benchmark-price decline and longer marketing times reported by CREB.
New listings moderated city-wide in June, which prevented inventory from rising as quickly as it otherwise might have. That reduction in new supply supported overall balance, but it did not remove the accumulated choice in softer segments. Price movement therefore followed market balance: relatively limited declines in the most competitive low-rise segments and larger declines where supply was high relative to sales.
What This Means for Buyers and Sellers
Buyers should treat the city-wide balanced-market label as a starting point, not as a negotiating rule. Apartment buyers and buyers in North East, City Centre, and East generally had more listings to compare and a greater ability to make price, condition, and possession terms part of the decision. In lower-supply detached and semi-detached markets, well-priced properties could still attract prompt interest, so preparation and property-specific evidence remained important.
Sellers face a similarly segmented market. Apartment and higher-supply district sellers need to price against current competing listings and recent sales, not against peak-market expectations or city-wide averages. Longer exposure and price reductions are more likely where a property enters the market above comparable alternatives. Detached and semi-detached sellers may have stronger conditions, but the decline in the overall benchmark price and softer list-price ratios still argue for disciplined pricing.
For both sides, the most useful comparison is the relevant property type, district, community, price range, and condition. A city-wide statistic cannot capture renovation quality, condominium fees, building reputation, lot characteristics, or immediate competing inventory. Decisions should therefore combine this report's market context with a current comparative market analysis for the specific property.
What to Watch Next
The first indicator to monitor is the late-summer inventory path. Calgary inventory normally changes seasonally, so the key question is whether active supply declines faster than sales after the spring listing peak. A faster reduction would support firmer market balance; persistent inventory would maintain or expand buyer choice.
The second indicator is apartment absorption. Apartment sales, months of supply, days on market, and benchmark-price movement should be assessed together. Improvement in only one measure would be insufficient to establish a durable change in direction.
The third indicator is whether the current divergence spreads to lower-supply segments. Detached and semi-detached conditions remained comparatively resilient in June. A sustained rise in their months of supply or a meaningful weakening in sales would signal broader softening. Conversely, continued stability in those segments would confirm that Calgary remains a collection of distinct submarkets rather than one uniformly weakening market.
Explore the Market in More Detail
Explore Calgary property-type and community market information at Calgary real estate areas, or contact Byron Henry for property-specific analysis.