
Calgary's residential market remained balanced in July 2026, but the city-wide result concealed a clear split by property type. Apartment and row conditions offered buyers more supply relative to sales and recorded the steepest benchmark-price declines, while detached and semi-detached segments were firmer. This report traces the 13-month market trajectory, compares property types, and shows how district-level supply conditions change once property type is considered.
Executive Summary
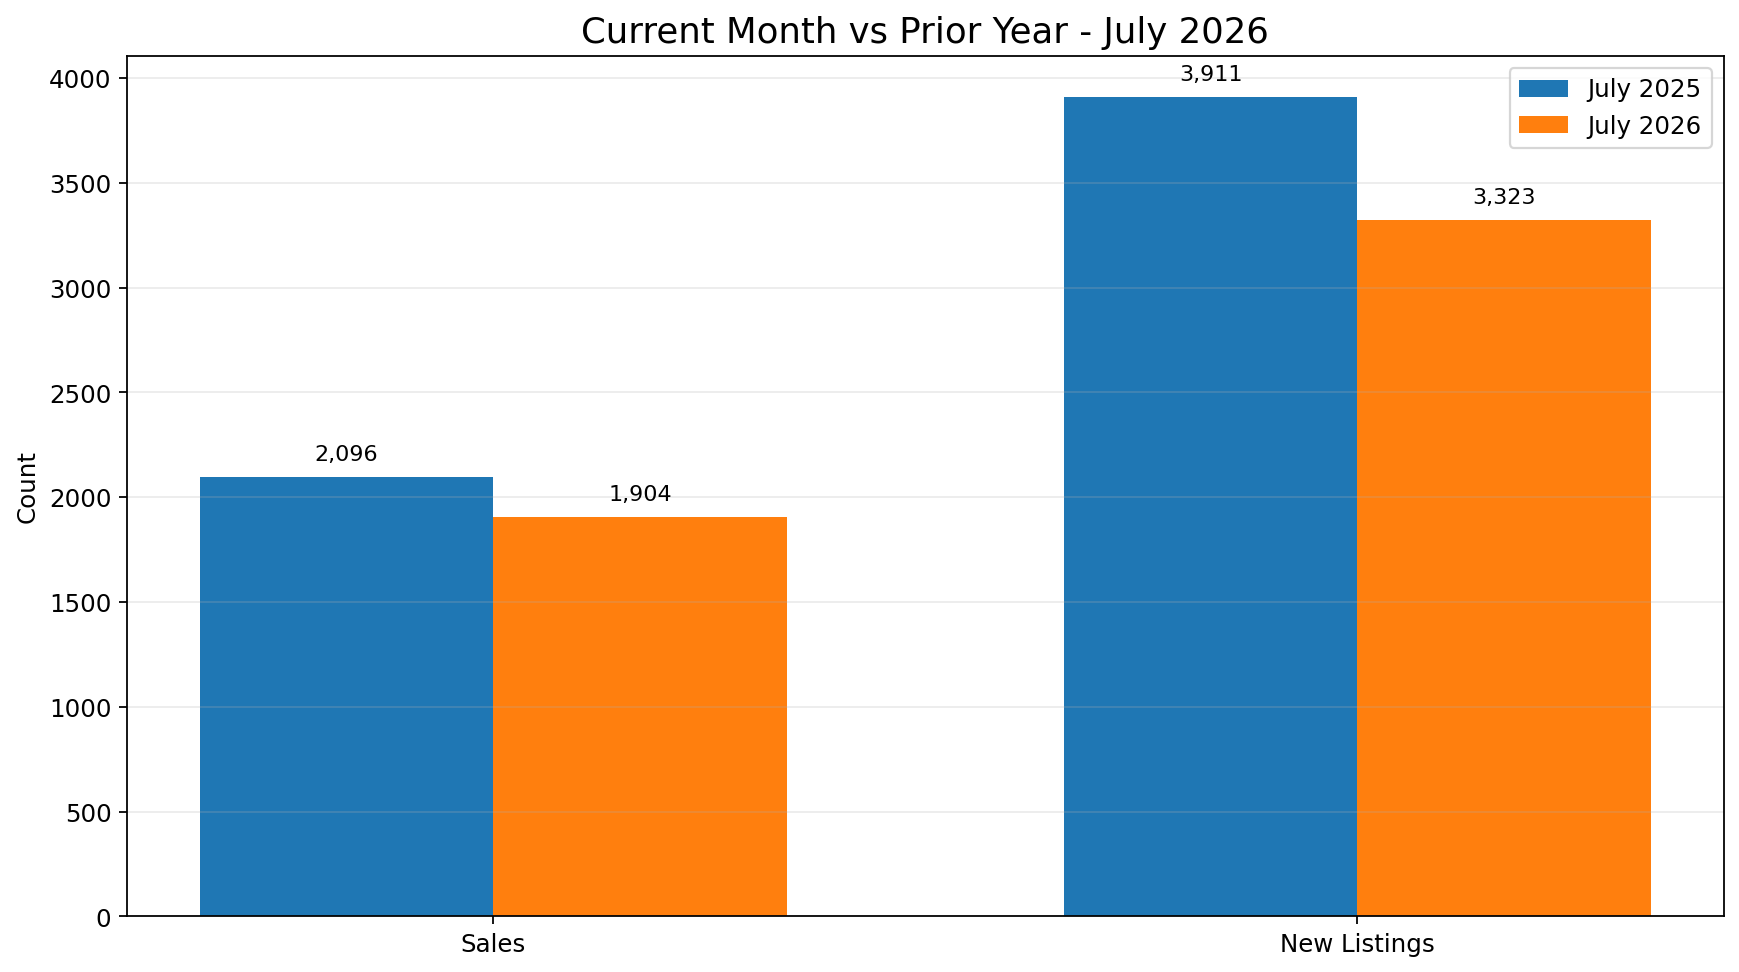
Calgary remained in balanced market territory in July, but the balance was not uniform across the city or across property types. City-wide Months of Supply was 3.48, while sales were 9.16% below July 2025 and new listings were 15.03% lower. Inventory was also lower year over year, by 4.23%, so the softer market balance reflects the relationship between the pace of sales and available supply rather than a simple build-up of listings. The residential benchmark price was $569,200, down 2.05% from a year earlier.
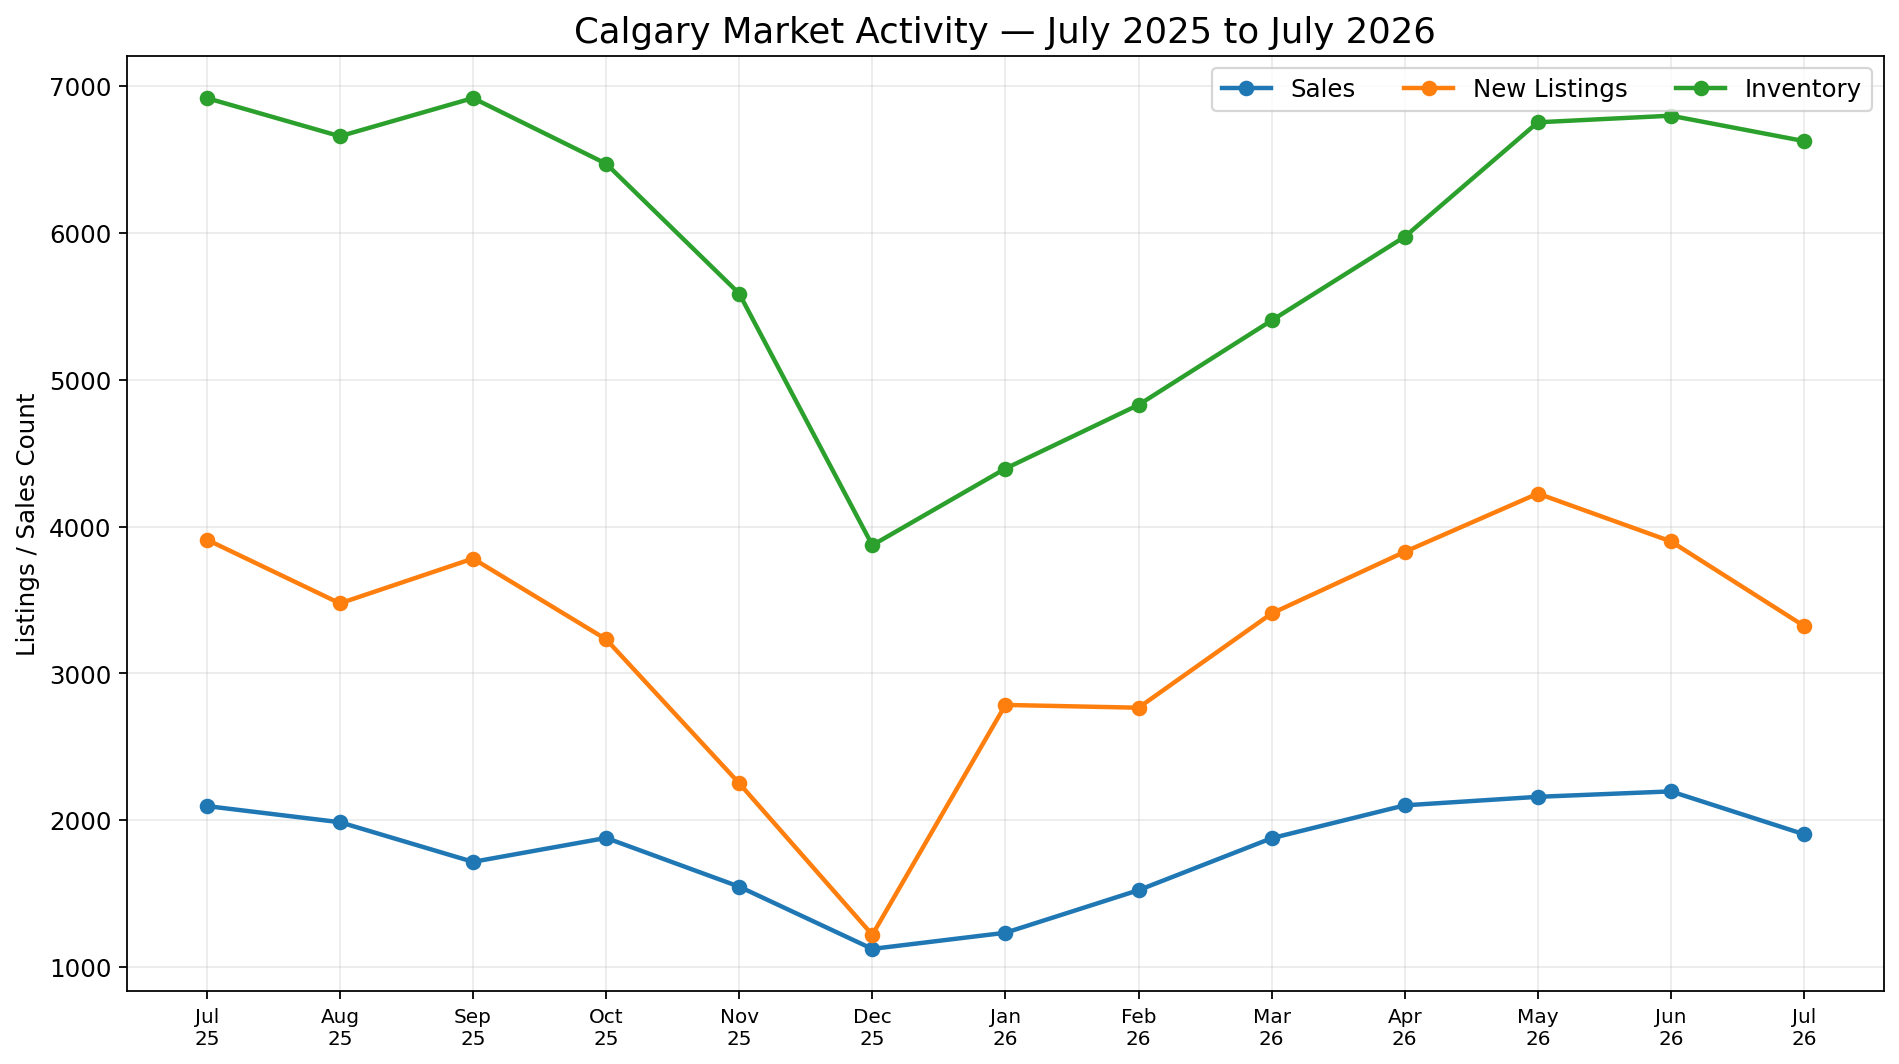
The 13-month trajectory shows a pronounced seasonal contraction through late 2025, followed by a spring 2026 recovery in both activity and inventory. By June, sales had reached 2,196 and inventory 6,799. July then brought a pullback in sales and new listings, while inventory eased only modestly to 6,626. That left buyers with more supply relative to the current sales pace than they had a year earlier, even though the number of listings for sale was lower.
Property type is where the market split becomes clearest. Semi-detached sales increased year over year and its benchmark price was nearly unchanged, while detached conditions were also comparatively firm. Row and apartment sales fell much more sharply, with Months of Supply rising to 3.90 and 4.90 respectively and benchmark prices declining 6.10% and 8.37%. District evidence reinforces the same point: the amount of choice available to a buyer depends materially on both location and property type. The practical result is a market that is balanced in aggregate but requires segment-specific expectations for pricing, negotiation and timing.
Calgary Market at a Glance
How Market Conditions Are Changing
Over the most recent 13 months, Calgary moved through a clear seasonal cycle while the relationship between demand and available supply gradually became less competitive. In July 2025, the city recorded 2,096 sales, 3,911 new listings and 6,919 units of inventory. Activity then slowed through the second half of the year. By December, sales had fallen to 1,123, new listings to 1,219 and inventory to 3,873. The decline in inventory during that period helped prevent the market from loosening as much as the drop in sales alone might suggest.
Activity rebuilt in early 2026. Sales increased from 1,233 in January to 2,196 in June, while inventory rose from 4,395 to 6,799. New listings also expanded into the spring, reaching 4,225 in May before easing to 3,899 in June. This simultaneous recovery in demand and supply meant that stronger sales did not translate into uniformly tighter conditions. Inventory remained high enough relative to the pace of transactions to preserve more buyer choice than was typical during the tighter portions of the previous cycle.
July marked a shift from the spring build-up. Sales eased to 1,904 and new listings to 3,323, while inventory declined more modestly to 6,626. Compared with July 2025, sales were down 9.16%, whereas inventory was down only 4.23%. That difference is important: even with fewer listings on the market than a year earlier, the slower sales pace produced 3.48 Months of Supply, up from 3.30 a year earlier. The residential benchmark price followed a similar arc. It declined from $581,100 in July 2025 to $554,700 in December, recovered through the first half of 2026 to $572,500 in June, and then eased to $569,200 in July. The overall trajectory is therefore one of recovery from the winter low followed by a softer July balance, rather than a simple story of continuously rising inventory.
Where the Market Is Diverging
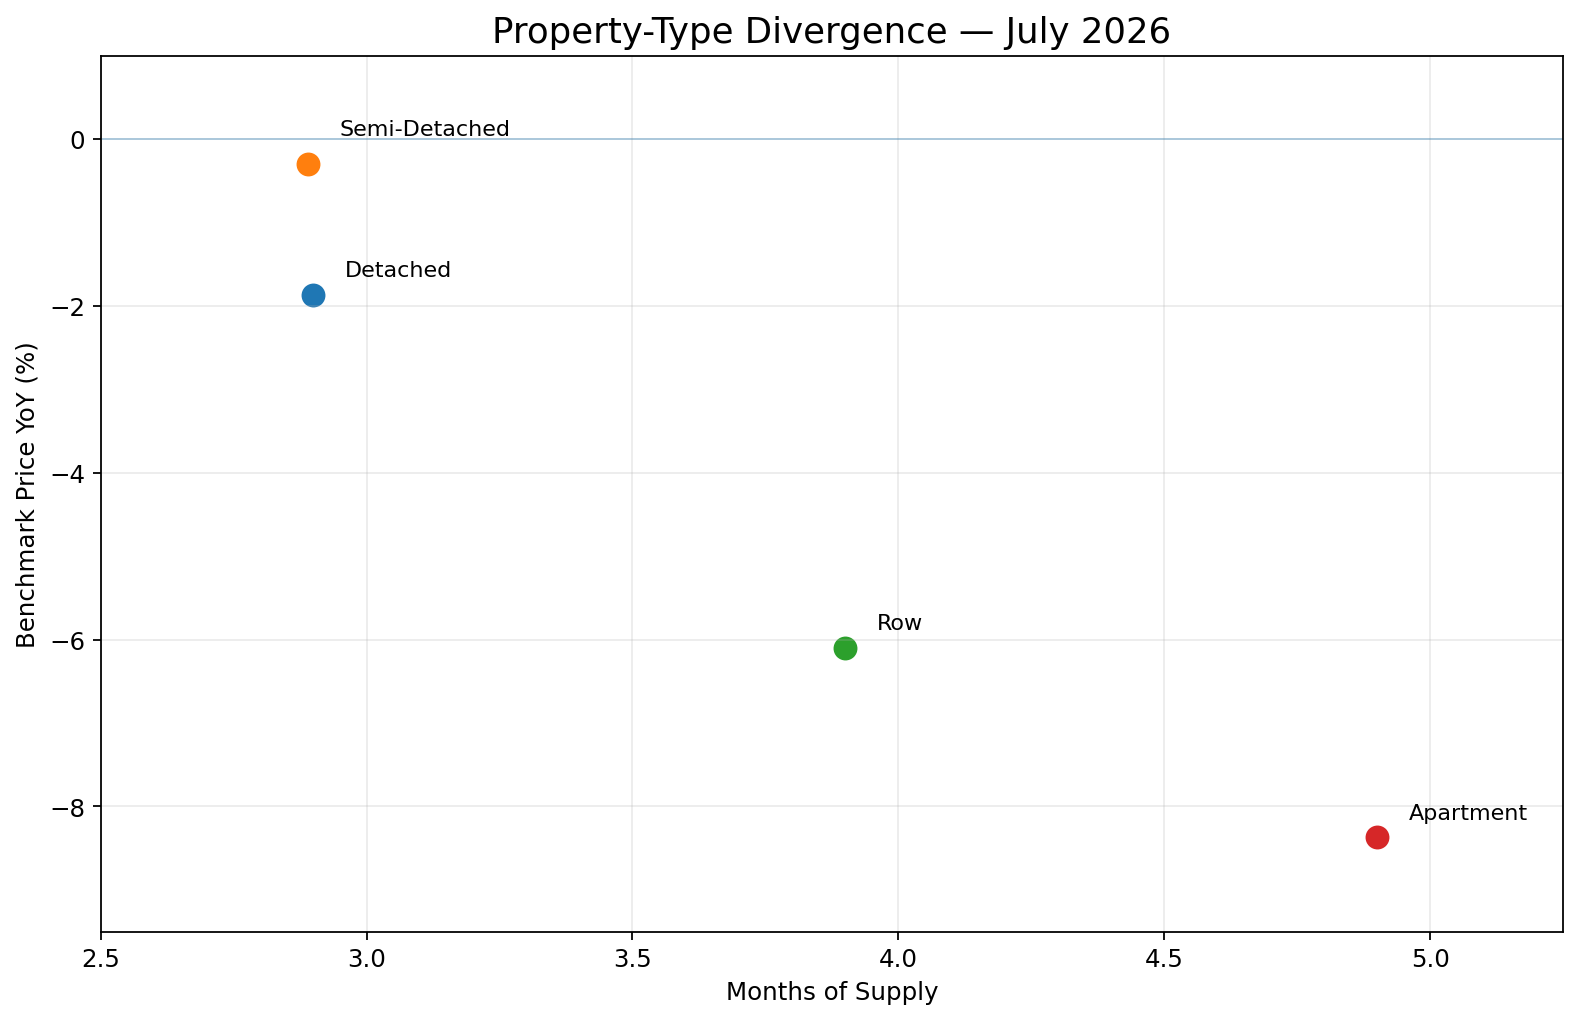
The city-wide result masks materially different conditions across Calgary's four principal residential property types. The strongest relative performance came from semi-detached homes. Sales were 5.88% higher than in July 2025, inventory was 4.75% higher, and Months of Supply was 2.89. The benchmark price was down only 0.30% year over year. That combination suggests that additional inventory was being absorbed by stronger sales activity, limiting the effect on price.
Detached homes were also comparatively firm. Sales were down 1.65% and inventory was down 4.55%, leaving Months of Supply at 2.90. The benchmark price declined 1.87%. The sales and inventory changes moved in the same direction and at similar magnitudes, so detached conditions did not loosen nearly as much as the city-wide sales decline might imply. Detached and semi-detached therefore finished July with almost identical Months of Supply even though their year-over-year sales and inventory movements were different. That is a useful reminder that the resulting balance matters more than any single component viewed by itself.
Row and apartment properties show the opposite pattern. Row sales were 22.91% lower year over year, while inventory was down 6.77%. Because sales fell much faster than inventory, Months of Supply rose to 3.90 and the benchmark price was 6.10% lower. Apartments were softer still: sales declined 19.84%, inventory declined 4.67%, Months of Supply reached 4.90, and the benchmark price fell 8.37%. The important contradiction is that inventory did not need to rise year over year for either segment to become less competitive. A sufficiently large reduction in sales can create more supply relative to demand even when the absolute number of listings is lower.
The ordering of the supply and price measures reinforces the divergence. Detached and semi-detached were both below three Months of Supply and had the smallest benchmark-price declines. Row moved closer to four Months of Supply and recorded a much larger price decline, while apartments had the most supply relative to sales and the largest benchmark-price decline. The evidence does not establish that Months of Supply alone caused those price changes, but the alignment shows that the softer price outcomes were concentrated in the segments where current absorption was weakest relative to available inventory.
This divergence also explains why a single city-wide benchmark or market-status label has limited value for individual decisions. Semi-detached and detached conditions were comparatively firm, while row and especially apartment properties offered materially more choice relative to demand. Reading only the year-over-year inventory changes would miss that distinction because inventory declined in three of the four segments. Reading only sales changes would also be incomplete because the market effect depends on how sales compare with supply. The four measures together support separate expectations for pricing, negotiation and timing by property type.
| Property Type | Sales Year-over-Year Change | Inventory Year-over-Year Change | Months of Supply | Benchmark Price Year-over-Year Change |
|---|---|---|---|---|
| Detached | -1.65% | -4.55% | 2.90 | -1.87% |
| Semi-Detached | +5.88% | +4.75% | 2.89 | -0.30% |
| Row | -22.91% | -6.77% | 3.90 | -6.10% |
| Apartment | -19.84% | -4.67% | 4.90 | -8.37% |
Geographic Differences
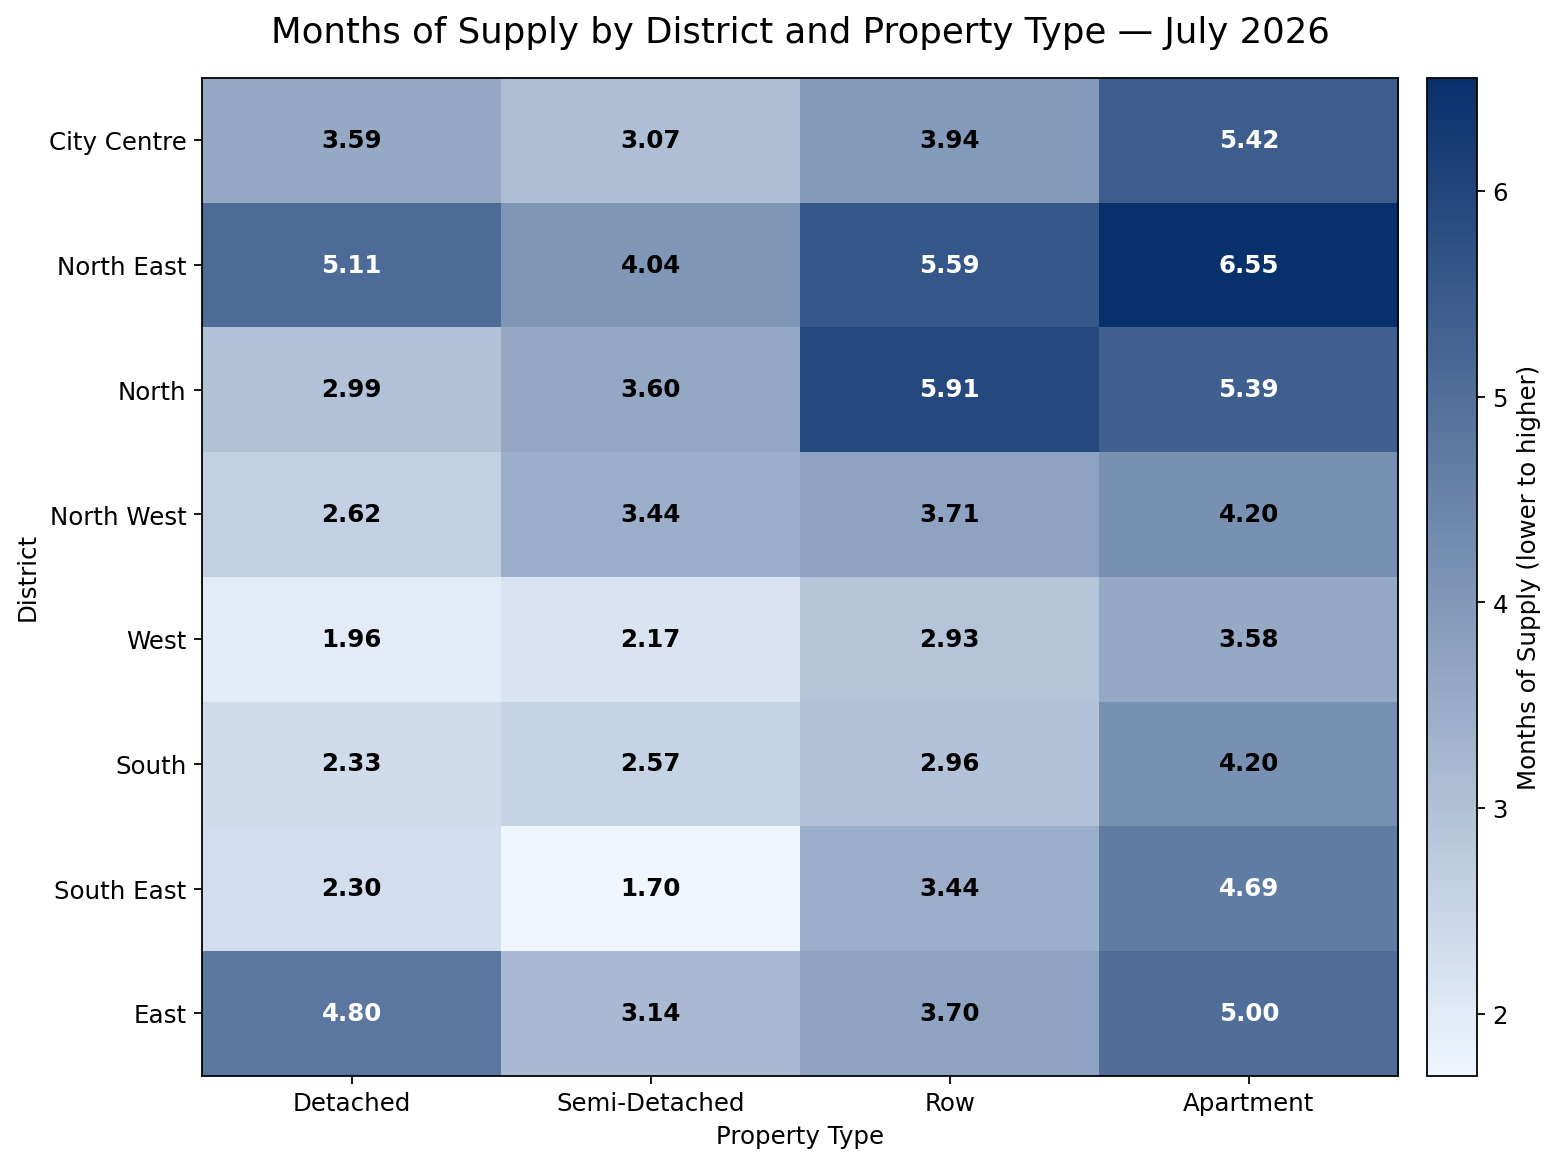
The district matrix shows that Calgary's supply picture changes substantially once property type is added to location. Higher-density properties generally carry more supply relative to sales than detached and semi-detached homes, but the pattern is not uniform. North East stands out for relatively high Months of Supply across every property type, while West is consistently tighter. North is a notable exception to the broader apartment pattern because row homes have the highest Months of Supply there.
Within-district differences are often as important as differences between districts. South East, for example, combines very tight semi-detached supply with much more apartment choice. East also shows a wide spread between its detached and apartment conditions and its semi-detached result. By contrast, West and South cluster more tightly at the lower end for detached, semi-detached and row homes before apartment supply increases.
These patterns mean that a district cannot be summarized reliably with one broad market label. A buyer considering an apartment may face a very different negotiating environment from a detached-home buyer in the same part of Calgary. The complete matrix below preserves the exact evidence while the narrative focuses on the material patterns and exceptions.
| District | Detached | Semi-Detached | Row | Apartment |
|---|---|---|---|---|
| City Centre | 3.59 | 3.07 | 3.94 | 5.42 |
| North East | 5.11 | 4.04 | 5.59 | 6.55 |
| North | 2.99 | 3.60 | 5.91 | 5.39 |
| North West | 2.62 | 3.44 | 3.71 | 4.20 |
| West | 1.96 | 2.17 | 2.93 | 3.58 |
| South | 2.33 | 2.57 | 2.96 | 4.20 |
| South East | 2.30 | 1.70 | 3.44 | 4.69 |
| East | 4.80 | 3.14 | 3.70 | 5.00 |
What Is Driving the Market
The clearest internal mechanism in July is the interaction between the sales pace and available inventory. Market balance is not determined by inventory in isolation. Row and apartment inventory were both lower than a year earlier, yet their Months of Supply was comparatively high because sales fell much faster than the number of homes available. That weaker absorption also coincided with the largest benchmark-price declines among the four property types.
Detached and semi-detached properties show the other side of the same mechanism. Detached inventory fell more than sales, while semi-detached sales increased alongside a smaller increase in inventory. In both cases, the relationship between supply and transactions kept Months of Supply below three and benchmark-price changes relatively modest. The contrast indicates that the city's softer price result is concentrated where demand has weakened most relative to available supply, rather than being evenly distributed across the market.
Geography reinforces this mechanism without requiring an external causal explanation. Districts with high Months of Supply in row or apartment categories are not necessarily loose in detached or semi-detached homes. The market is therefore being shaped by uneven absorption across both property type and location. The governed evidence establishes those internal relationships; it does not, on its own, identify a single external cause for why buyers are redistributing activity among segments.
What This Means for Buyers and Sellers
For buyers, July's balanced city-wide classification should be treated as a starting point rather than a description of every search. Apartment buyers generally have more supply relative to sales, and row buyers also face less competitive conditions than detached or semi-detached buyers. That can translate into more time to compare listings, greater sensitivity to pricing and condition, and more room to evaluate alternatives before committing. The district matrix matters as well: a buyer who changes either location or property type may encounter a materially different level of choice even when the overall Calgary market has not changed.
Detached and semi-detached buyers should be prepared for firmer conditions in several districts, particularly where Months of Supply remains low. A balanced city-wide market does not guarantee that well-positioned listings in tighter segments will face limited competition. The practical implication is to compare a property against its own segment and district rather than using the city-wide benchmark as the sole reference point.
For sellers, the same divergence makes accurate positioning more important. Apartment and row sellers are competing in segments where the current sales pace is weaker relative to available inventory and benchmark prices have fallen more sharply. Pricing that ignores that supply-demand relationship risks extending market time or requiring later adjustments. Detached and semi-detached sellers have comparatively firmer evidence, but results still vary by district and by the specific alternatives available to buyers.
Neither side should interpret the July figures as a forecast. They describe the current balance of supply, demand and pricing. The most useful application is to anchor expectations in the relevant property type and district, then reassess as new inventory and sales evidence changes. For both buyers and sellers, that also means distinguishing a city-wide change from a segment-specific change before adjusting strategy. A softer aggregate number can coexist with firm local conditions, just as a balanced aggregate can coexist with substantially more buyer choice in a particular segment.
What to Watch Next
First, watch the relationship between sales and inventory after the spring and early-summer peak. A meaningful tightening would require inventory to fall faster than the sales pace, or sales to strengthen while inventory holds or declines. That would matter because it would reduce the amount of choice available per transaction and could increase competition.
Second, watch absorption in row and apartment properties. If sales begin recovering relative to inventory, their Months of Supply should compress; if sales remain weak while inventory is stable, the current pricing pressure is more likely to persist. The direction of that relationship matters more than inventory changes alone.
Third, watch whether the district-by-property-type spreads narrow or widen. A sustained narrowing would indicate that conditions are becoming more uniform across Calgary, while wider gaps would make segment-specific pricing and negotiation even more important.
Explore the Market in More Detail
Sources and Methodology
This report uses the official CREB® City of Calgary Monthly Statistics, July 2026 as the source for city-wide, property-type and district statistics. The measures include sales, new listings, inventory, benchmark-price changes and Months of Supply.
The overall market status is based on the official city-wide Months of Supply measure. Property-type and district comparisons use the corresponding published CREB values for July 2026 so the exact evidence remains consistent across the report, charts and tables.