
Calgary's residential market remained balanced in August 2026, but it moved close to the upper edge of that range as sales slowed faster than inventory. Apartments remained the softest property type, while semi-detached benchmark prices were still above year-earlier levels despite weaker sales. This report traces the 13-month shift in activity, compares property types, and shows how district-level supply can differ sharply within the same city-wide market.
Executive Summary
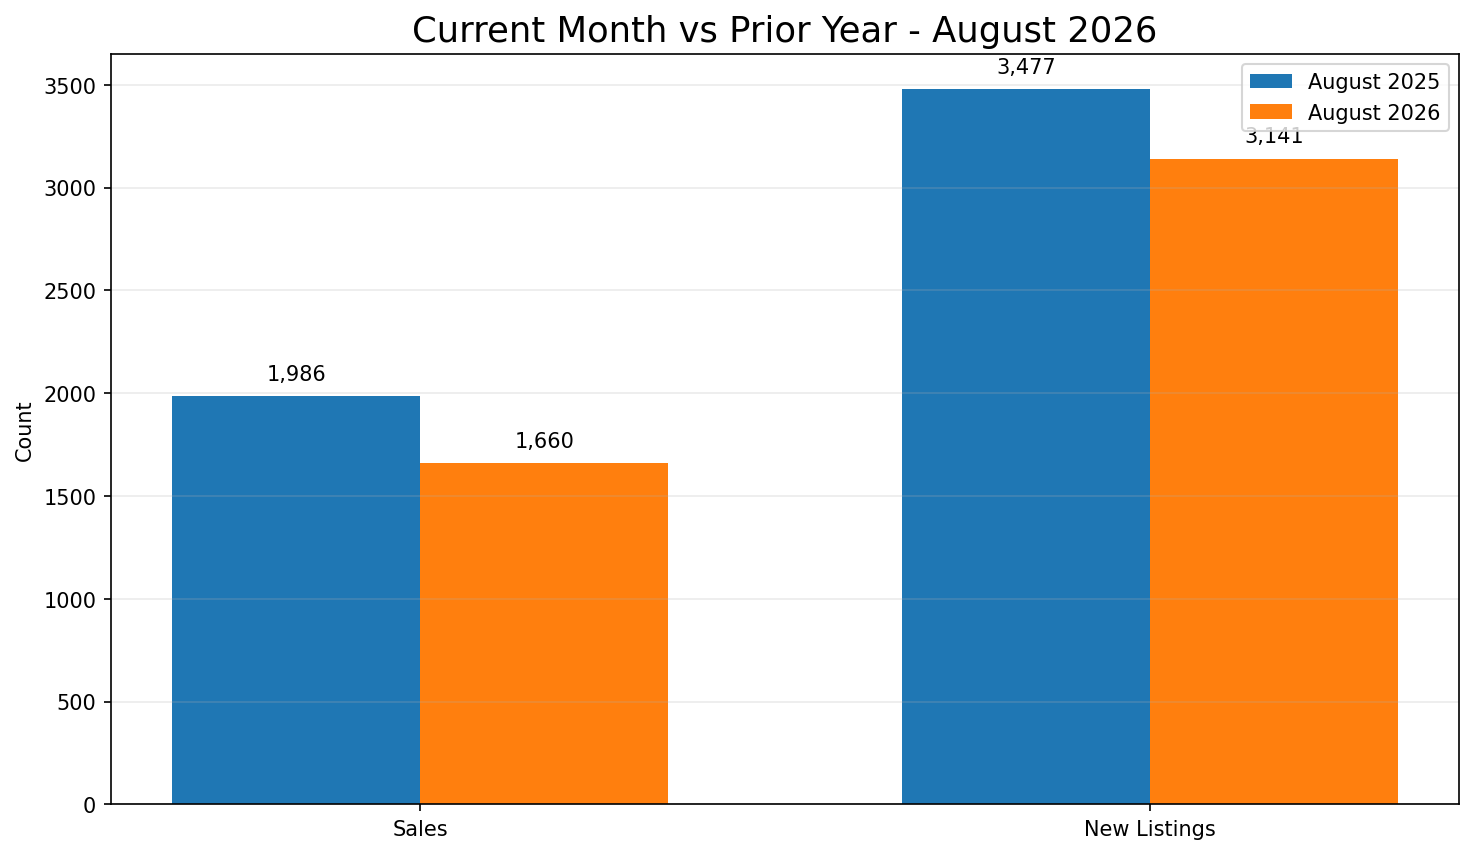
Calgary remained in a Balanced Market in August 2026, but conditions softened as the relationship between sales and available inventory moved closer to buyer-favouring territory. Official CREB data recorded 1,660 sales, down 16.41% from August 2025, while inventory declined only 2.25% to 6,509 units. Months of Supply therefore increased from 3.35 to 3.92, just below the governed 4.0 upper boundary of balanced conditions. The residential benchmark price was $569,800, down 1.08% year over year, and Days on Market increased from 38 to 41.
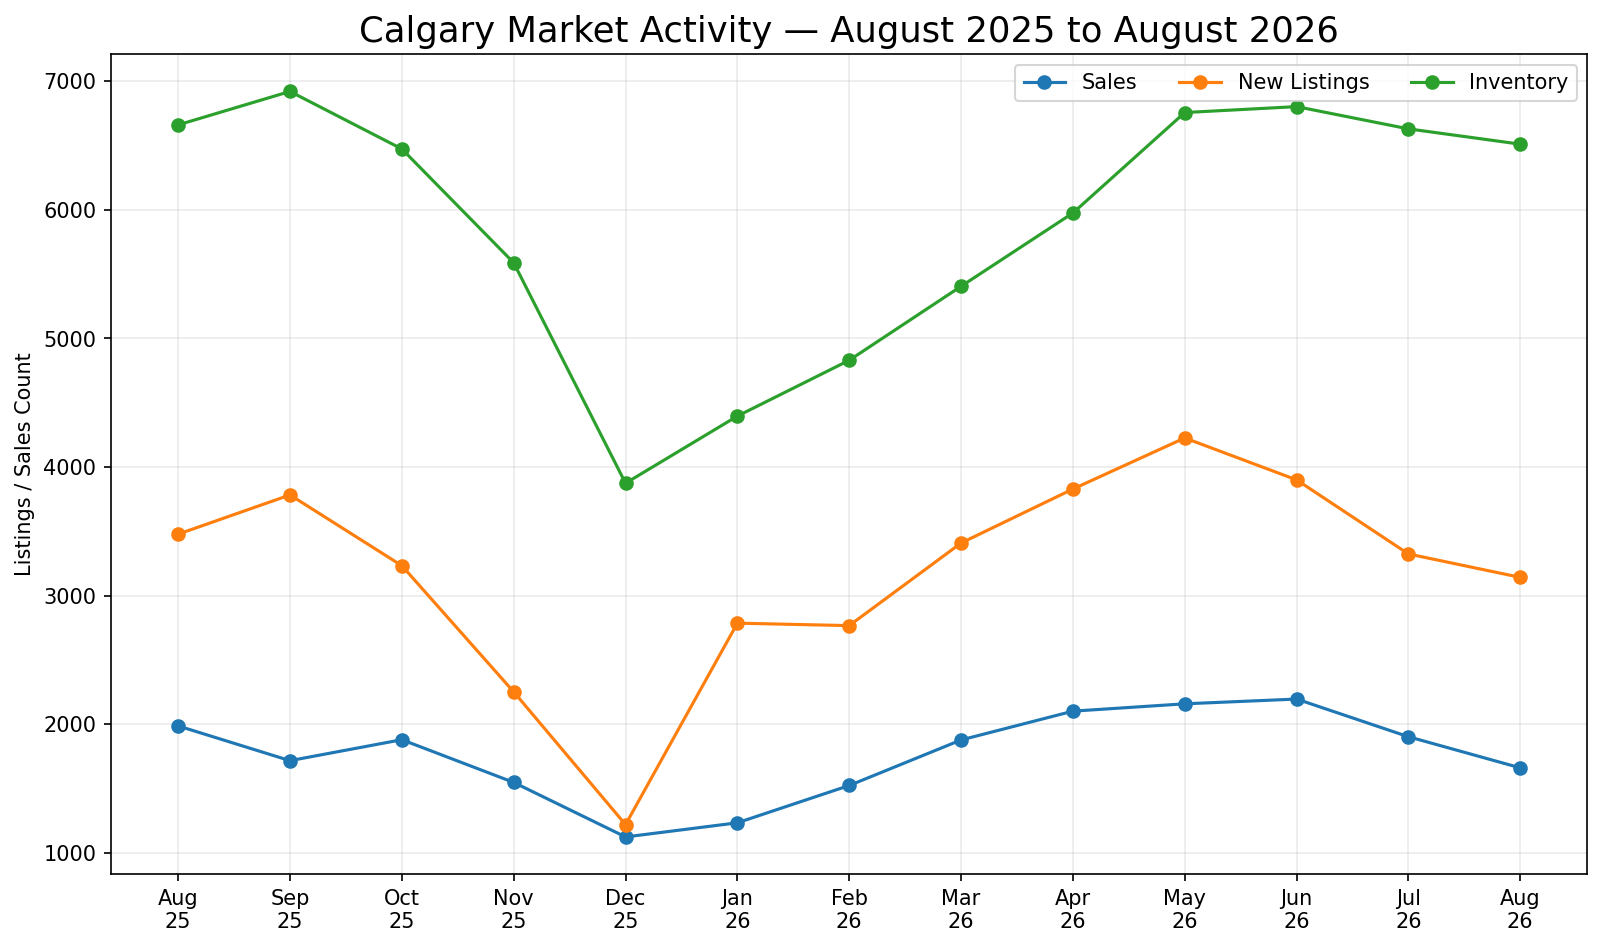
The 13-month trajectory shows a seasonal contraction through late 2025 followed by a substantial spring recovery in both sales and inventory. Sales reached 2,195 in June 2026 before easing to 1,902 in July and 1,660 in August. Inventory also retreated after June, but more gradually, declining from 6,801 to 6,628 and then 6,509. That difference in pace increased the amount of available supply relative to transactions.
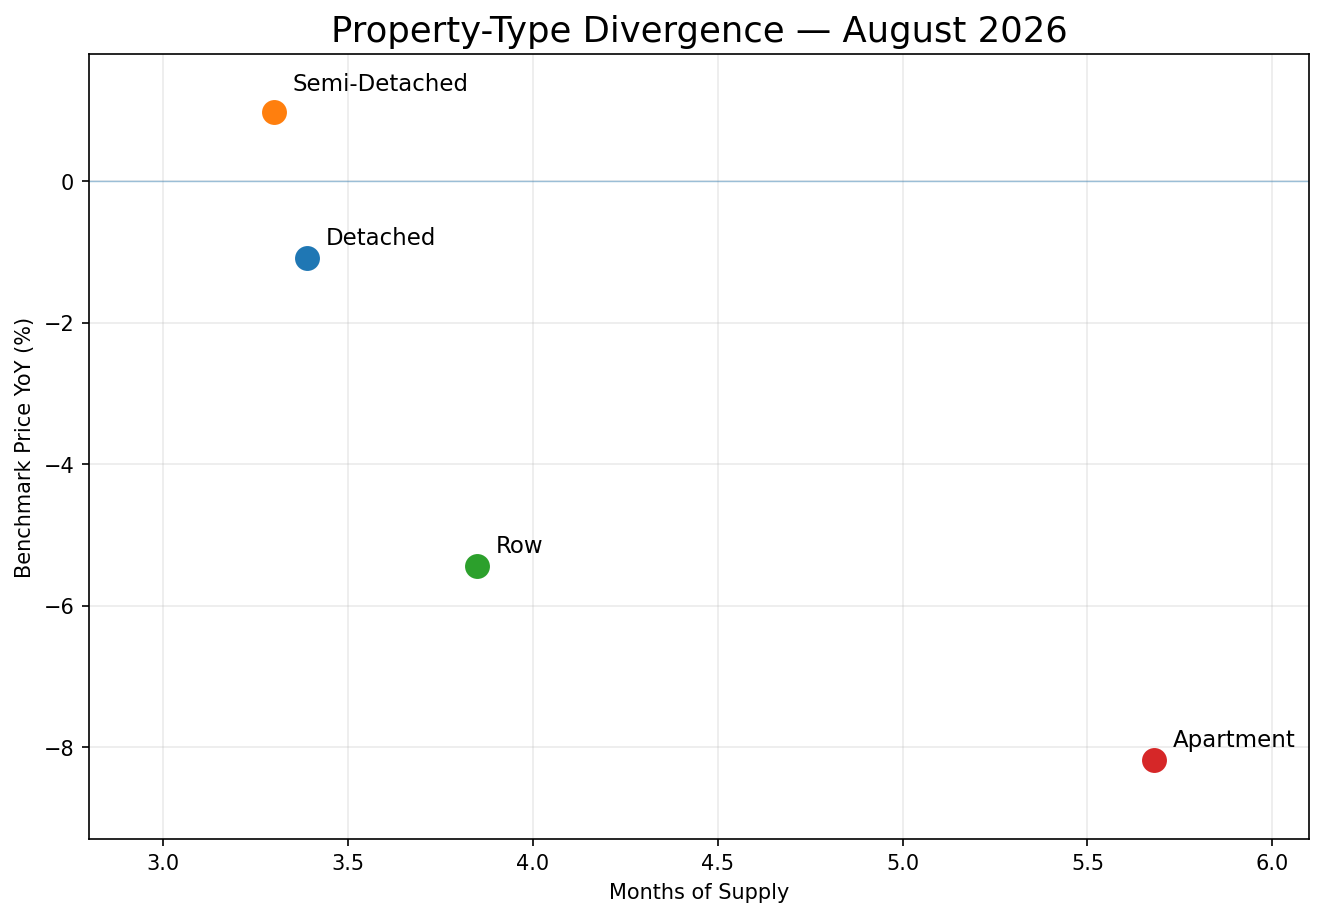
Property types remained sharply divided. Detached and semi-detached homes were still within balanced conditions at 3.39 and 3.30 Months of Supply. Row homes were also balanced at 3.85, but their benchmark price was down 5.44%. Apartments were in a Buyer's Market at 5.68 Months of Supply and recorded the largest benchmark-price decline, down 8.18%.
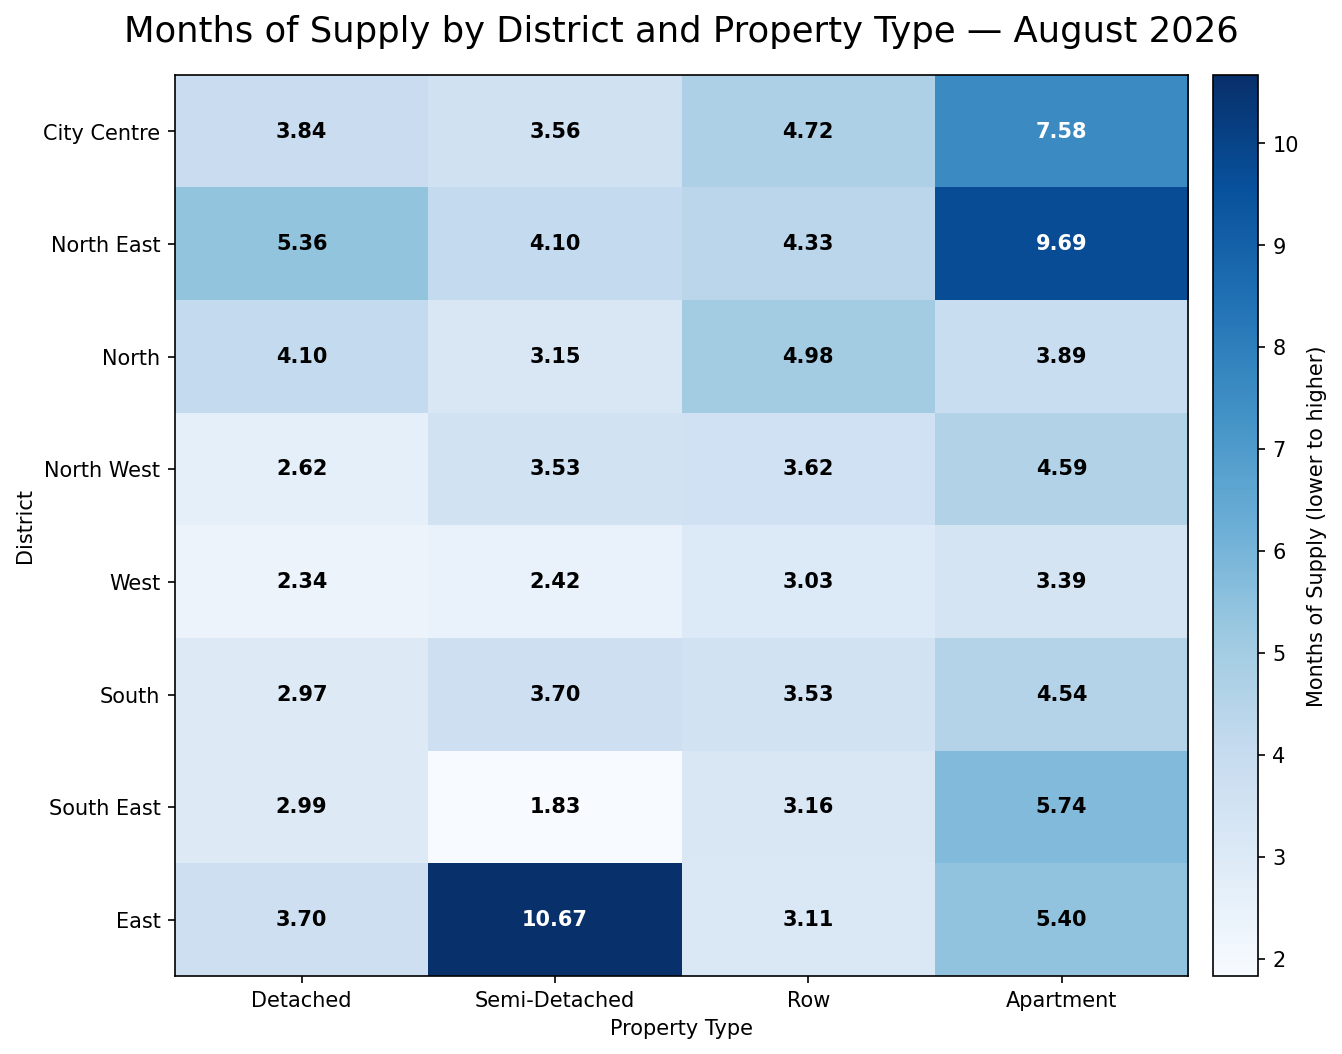
District evidence reinforces why the city-wide label needs context. West remained comparatively tight across property types, while North East carried higher supply in every category. Several districts also showed wide internal spreads, including South East and East. For buyers and sellers, the practical implication is to anchor decisions in the relevant property type and district rather than assuming Calgary's 3.92 Months of Supply describes every segment equally.
Calgary Market at a Glance
How Market Conditions Are Changing
The 13-month city-wide series shows Calgary moving through three distinct phases. In August 2025, the market recorded 1,986 sales, 3,477 new listings and 6,659 units of inventory. Activity then contracted through the autumn. Sales reached a low of 1,123 in December, while new listings fell to 1,219 and inventory declined to 3,873. That year-end reduction in inventory was substantial, but it occurred alongside an even sharper seasonal decline in transactions.
Activity rebuilt quickly in early 2026. Sales rose from 1,233 in January to 1,523 in February, 1,877 in March and 2,101 in April. They reached 2,158 in May and peaked at 2,195 in June. New listings followed a similar spring expansion, increasing from 2,785 in January to 4,225 in May before easing to 3,899 in June. Inventory accumulated more persistently, rising from 4,395 in January to 6,755 in May and 6,801 in June.
The latest two months mark a change in that spring pattern. Sales fell to 1,902 in July and 1,660 in August, a 24% decline from June. Inventory also declined, but by only about 4% over the same interval, to 6,509. New listings eased to 3,323 in July and 3,141 in August. Because transaction activity fell faster than the stock of available homes, Months of Supply increased to 3.92 in August from 3.35 a year earlier.
Price and market-time measures are consistent with a market that has become less competitive without undergoing a broad price collapse. The benchmark price was $569,800, 1.08% below August 2025 and slightly above July's $569,200. Days on Market increased from 38 to 41 year over year. Taken together, the trajectory shows that the current softening is primarily an absorption story: supply has started to decline from its spring peak, but the sales pace has weakened more quickly. The August sales-to-new-listings ratio also fell to 52.85% from 57.12% a year earlier, reinforcing that new supply is being absorbed less quickly even though fewer new listings entered the market.
Where the Market Is Diverging
August's property-type evidence shows that the city-wide 3.92 Months of Supply conceals materially different balances. Detached homes recorded 875 sales, down 11.79% year over year, while inventory fell 2.69% to 2,969. Months of Supply rose from 3.08 to 3.39 and the detached benchmark price declined 1.09% to $744,300. That places detached conditions within the balanced range, with weaker sales but a comparatively modest price change.
Semi-detached homes also remained balanced at 3.30 Months of Supply, but their pattern was different. Sales fell 18.45% to 168 while inventory increased 4.91% to 555. Even with that softer absorption, the benchmark price was $690,500, 0.98% above August 2025. Semi-detached is therefore an important exception to any simple assumption that higher Months of Supply must immediately produce a year-over-year benchmark-price decline.
Row homes sat closer to the upper edge of balanced conditions. Sales declined 16.22% to 284, inventory was nearly unchanged at 1,094, and Months of Supply rose from 3.24 to 3.85. The row benchmark price fell 5.44% to $415,200. Compared with detached and semi-detached homes, row properties combined a weaker sales-to-supply relationship with a materially larger price decline.
Apartments remained the clearest outlier. Sales fell 25.84% to 333, substantially more than the 4.45% reduction in inventory to 1,891. Months of Supply increased from 4.41 to 5.68, placing the segment in a Buyer's Market under the governed thresholds. The apartment benchmark price fell 8.18% to $295,400, the largest decline among the four property types.
The broad ordering is therefore consistent: segments with more supply relative to transactions generally show weaker price outcomes, with apartments at the softest end and detached homes much firmer. But the semi-detached result demonstrates why the relationship should be interpreted rather than treated as a mechanical pricing rule. Benchmark prices reflect the market's transaction evidence, while Months of Supply measures current balance; they can move differently over shorter periods.
For individual decisions, the divergence matters more than the average. An apartment buyer is entering a market with substantially more current choice relative to sales than a detached or semi-detached buyer. Row buyers occupy an intermediate position. Sellers face the same distinction in reverse: the amount of competing supply that must be absorbed, and the price evidence associated with it, varies materially by property type even before location is considered. The year-over-year inventory changes underline the point. Inventory declined in detached, row and apartment housing, yet all three recorded higher Months of Supply because their sales pace weakened enough to offset those inventory reductions. Semi-detached inventory actually increased, but its price result remained positive. The relevant comparison is therefore not simply whether inventory rose or fell; it is how the available stock relates to current transaction activity, then how that balance is reflected in the price evidence.
| Property Type | Sales YoY | Inventory YoY | Months of Supply | Benchmark Price YoY |
|---|---|---|---|---|
| Detached | -11.79% | -2.69% | 3.39 | -1.09% |
| Semi-Detached | -18.45% | +4.91% | 3.30 | +0.98% |
| Row | -16.22% | -0.55% | 3.85 | -5.44% |
| Apartment | -25.84% | -4.45% | 5.68 | -8.18% |
Geographic Differences
The district matrix adds a second layer of divergence. Apartment supply is elevated across much of Calgary, with particularly high Months of Supply in North East and City Centre, while West remains comparatively tighter. North East also stands out because all four property types carry more supply relative to sales than their counterparts in several western and southern districts.
The more important pattern is the size of the spread within individual districts. South East combines very tight semi-detached conditions with much softer apartment conditions. East is even more unusual: semi-detached Months of Supply is exceptionally high while row and detached conditions are much lower. North reverses the common apartment-led pattern because row homes have more Months of Supply than apartments.
West is the clearest example of a district where ground-oriented property types remain relatively tight, and its apartment reading is also below many other districts. By contrast, North East is broadly softer across categories. These differences show why neither district nor property type is sufficient on its own. The complete 8 x 4 matrix preserves the exact values, while the useful interpretation is that negotiating conditions can change materially when either location or housing form changes.
| District | Detached | Semi-Detached | Row | Apartment |
|---|---|---|---|---|
| City Centre | 3.84 | 3.56 | 4.72 | 7.58 |
| North East | 5.36 | 4.10 | 4.33 | 9.69 |
| North | 4.10 | 3.15 | 4.98 | 3.89 |
| North West | 2.62 | 3.53 | 3.62 | 4.59 |
| West | 2.34 | 2.42 | 3.03 | 3.39 |
| South | 2.97 | 3.70 | 3.53 | 4.54 |
| South East | 2.99 | 1.83 | 3.16 | 5.74 |
| East | 3.70 | 10.67 | 3.11 | 5.40 |
What Is Driving the Market
August's softening is best explained by the changing relationship between the sales pace and available inventory. City-wide inventory was lower than a year earlier, so the market did not weaken because the number of homes for sale surged. Instead, sales fell much faster than inventory, increasing the amount of supply available for each completed transaction and lifting Months of Supply from 3.35 to 3.92.
The same mechanism appears most clearly in apartments. Inventory was down 4.45% year over year, yet sales fell 25.84%, pushing Months of Supply to 5.68. Row inventory was almost unchanged while sales fell 16.22%, raising Months of Supply to 3.85. In both cases, weaker absorption coincided with larger benchmark-price declines than in detached and semi-detached housing.
The district matrix shows that this absorption imbalance is not distributed uniformly. A property type can be relatively tight in one district and materially looser in another, which means the city-wide shift is being produced by many different local supply-to-sales relationships rather than one common condition everywhere.
The governed evidence supports this internal explanation but does not establish why buyers reduced activity or why demand differed among segments. Interest rates, migration, affordability or other external factors may be relevant in a broader analysis, but they are not required to explain what the August CREB measures themselves show: sales have slowed more quickly than available supply can adjust.
What This Means for Buyers and Sellers
For buyers, August's 3.92 Months of Supply means Calgary remains balanced overall, but it is close to the upper boundary of that range. That generally provides more choice and less urgency than a market where sales are absorbing available inventory rapidly. The benefit is not uniform, however. Apartment buyers have the greatest supply relative to the current sales pace, while detached and semi-detached buyers are still operating in firmer city-wide conditions. Row homes sit between those positions.
Location can materially change that experience. A buyer who broadens a search from West to North East, or changes from a semi-detached home to an apartment, may move into a substantially different negotiating environment without leaving Calgary. The district matrix is therefore more useful for transaction strategy than treating the city-wide market status as a universal description. Current competing listings, recent sales and property condition still need to be assessed within the specific segment.
For sellers, the August evidence increases the importance of realistic positioning. Sales have slowed more than inventory city-wide, so buyers generally have more alternatives per transaction than they did a year ago. Apartment and row sellers face the clearest evidence of softer absorption and larger benchmark-price declines. Detached sellers have comparatively firmer conditions, while semi-detached sellers should not assume the positive year-over-year benchmark change eliminates the effect of slower sales and higher inventory.
The key is to distinguish market balance from guaranteed outcomes. A property can still sell quickly in a balanced or buyer-oriented segment if its price, condition and location compare well with the alternatives, just as a poorly positioned listing can struggle in a tighter segment. August's data should therefore be used to calibrate expectations, not to substitute a city-wide statistic for a property-specific market analysis.
For both sides, the most useful comparison is the immediate competitive set. The city-wide numbers establish direction; property type and district refine the balance; and individual comparable sales and active listings determine how that balance applies to a particular home.
What to Watch Next
First, watch the city-wide Months of Supply reading. August reached 3.92, just below the governed 4.0 boundary between Balanced and Buyer's Market conditions. A move above 4.0 would change the city-wide classification and signal that available supply has increased further relative to the sales pace.
Second, watch whether sales stabilize relative to inventory after the July-August slowdown. If sales recover while inventory continues to decline, Months of Supply should compress; if sales weaken faster than inventory, buyer choice per transaction should continue to expand.
Third, watch the apartment and row segments separately. Improving absorption would require sales to strengthen relative to their available inventory, while continued high Months of Supply would keep their current softness distinct from detached and semi-detached housing. Also watch whether the unusually wide district spreads, particularly in East and South East, persist or normalize, because that determines how useful any broad city or district label is for individual transactions.
Explore the Market in More Detail
Sources and Methodology
This report uses the official CREB® City of Calgary Monthly Statistics, August 2026 as the source for city-wide, property-type and district statistics. The measures include sales, new listings, inventory, benchmark-price changes and Months of Supply.
The overall market status is based on the official city-wide Months of Supply measure. Property-type and district comparisons use the corresponding published CREB values for August 2026 so the exact evidence remains consistent across the report, charts and tables.