
Calgary's detached housing market remained balanced in September 2026, with 3.31 months of supply. Sales rose from a year earlier while new listings and inventory were lower, and the benchmark price was modestly below September 2025. This report follows the 13-month trajectory, compares activity across six price ranges, examines district-level supply and price changes, and translates those differences into practical context for buyers and sellers.
Executive Summary
Calgary's detached market remained balanced in September 2026, but the underlying evidence was mixed. Official CREB data recorded 896 sales, up 4.43% from a year earlier, while new listings fell 9.35% to 1,726 and inventory declined 7.28% to 2,968. Months of supply therefore moved down from 3.73 to 3.31. The benchmark price was $739,400, 0.95% below September 2025 and below the June 2026 high of $750,500.
The 13-month trajectory shows a market that rebuilt activity and inventory through the spring before both sales and new-listing flow eased into late summer. Price-range results were not uniform. Sales increased most under $500,000 and at $1,000,000+, while the $600,000-$799,999 ranges posted annual declines. Listing-derived new listings also fell sharply through much of the $600,000-$999,999 range, and current Active-only listing counts were concentrated in several mid-to-upper price bands.
Geographic differences were equally important. West had 2.73 months of supply and a 2.69% annual benchmark increase, while North East had 5.61 months of supply and a 6.01% benchmark decline. Other districts fell between those extremes. For buyers and sellers, the central implication is that the citywide balanced result does not describe every segment equally; current price-range and district comparables remain essential to understanding competition, available choice and pricing sensitivity.
Detached Market at a Glance
Official CREB measures place Calgary's detached market in balanced conditions for September 2026.
Source: CREB® City of Calgary Monthly Statistics, September 2026.
How the Detached Market Is Changing
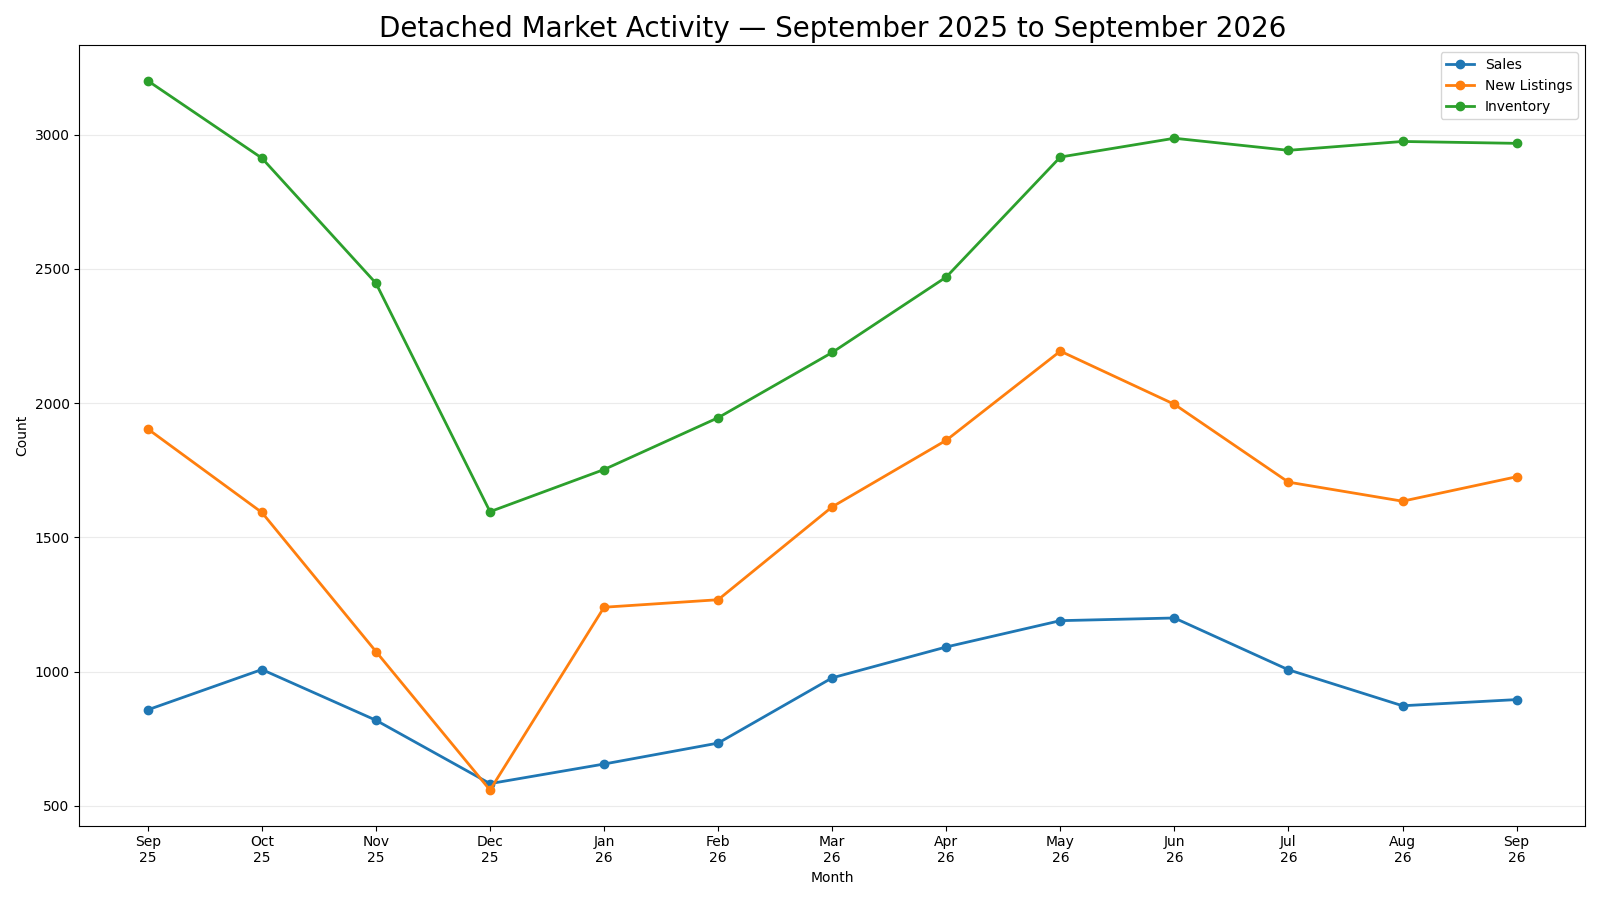
The September citywide figures show a detached market that was somewhat more competitive than a year earlier, but not one moving uniformly in a single direction. Sales reached 896, up 4.43% from September 2025, while new listings fell 9.35% to 1,726 and inventory declined 7.28% to 2,968. That combination reduced months of supply from 3.73 to 3.31. The benchmark price, however, was $739,400, 0.95% below a year earlier, so tighter supply relative to sales has not translated into broad annual price growth.
The 13-month series helps put that snapshot in context. Detached sales moved from 858 in September 2025 down to 583 in December, then increased through the first half of 2026, reaching 1,200 in June. New listings followed a similar rise into the spring, peaking at 2,194 in May, while inventory rebuilt from 1,596 in December to just under 3,000 by May. The benchmark price also recovered from $724,000 in January to $750,500 in June. Those movements show activity, incoming supply and available inventory expanding together through the spring rather than one indicator moving in isolation.
Since June, the pattern has changed. Sales eased to 1,007 in July and 873 in August before edging up to 896 in September. New listings also moved lower from their spring high, while inventory stayed close to 3,000 for five consecutive months from May through September. September itself brought 23 more sales and 91 more new listings than August, while inventory was virtually unchanged. The benchmark price slipped from the June high to $739,400 in September. The result is a balanced market with less year-over-year supply and a modest late-summer improvement in sales, but with pricing still softer than both the June peak and September 2025. Compared with August, that left the market with slightly more completed activity while available inventory was essentially unchanged heading into fall.
Where the Detached Market Is Diverging
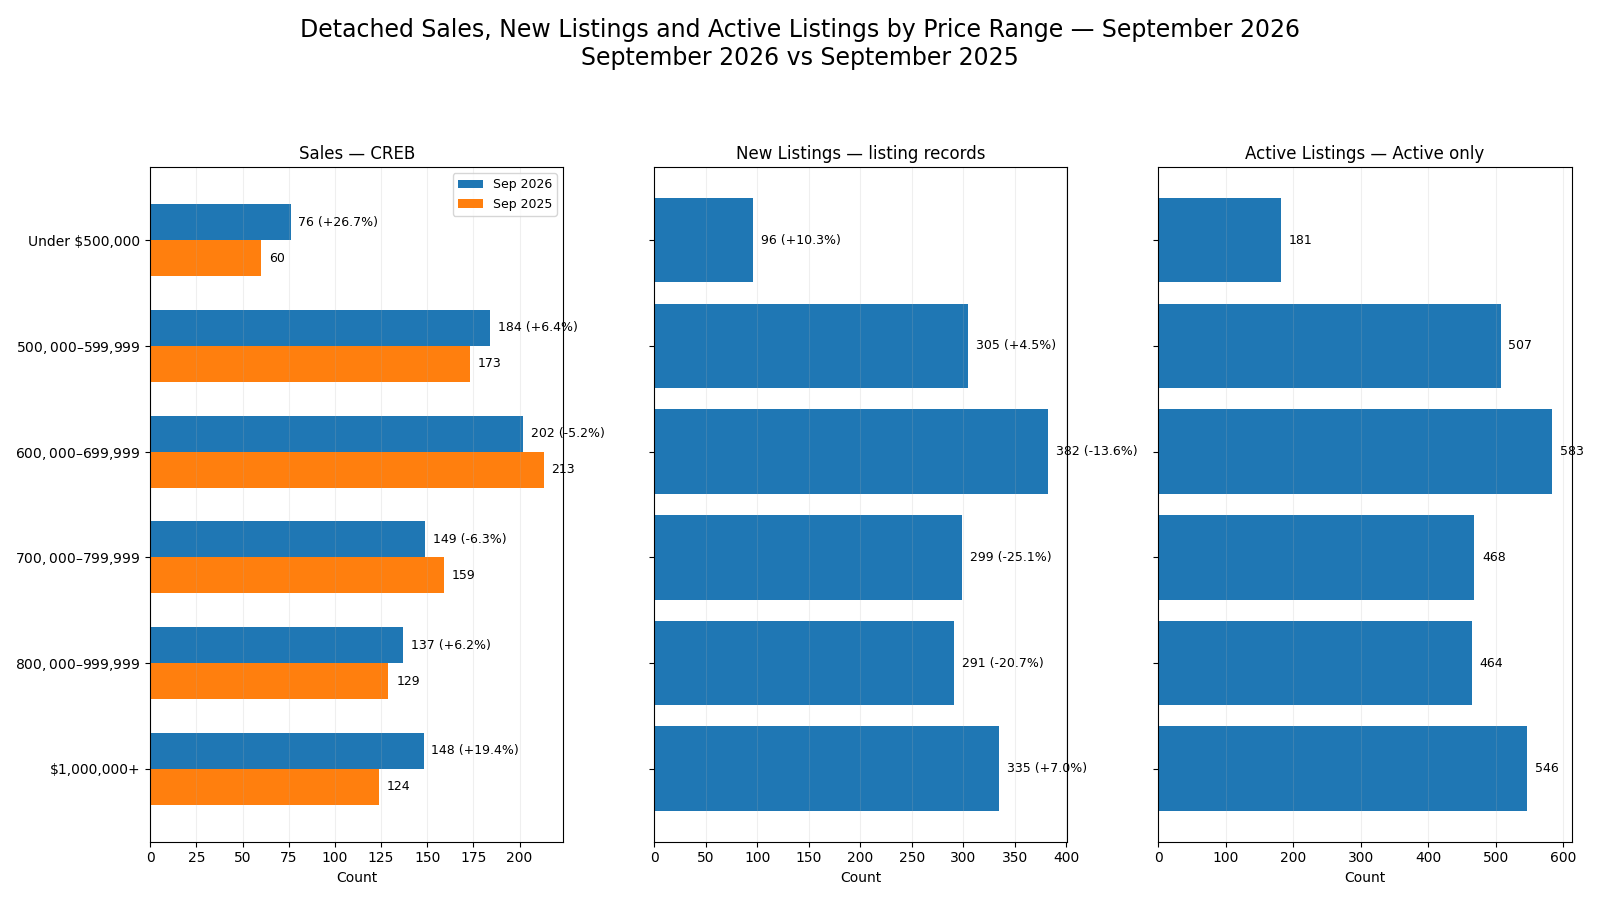
Price-range results show that the change in detached sales was concentrated rather than broad-based. Sales under $500,000 rose 26.7% year over year to 76, and sales at $1,000,000 and above increased 19.4% to 148. The $500,000-$599,999 and $800,000-$999,999 ranges also posted gains of 6.4% and 6.2%. By contrast, sales declined 5.2% in the $600,000-$699,999 range and 6.3% in the $700,000-$799,999 range. The citywide increase in sales therefore masks weaker activity through part of the middle of the detached price spectrum.
The listing-derived new-listing counts add a different dimension. New listings increased 10.3% under $500,000, 4.5% from $500,000-$599,999 and 7.0% at $1,000,000 and above. They fell 13.6% from $600,000-$699,999, 25.1% from $700,000-$799,999 and 20.7% from $800,000-$999,999. Current Active Listings were highest in the $600,000-$699,999 range at 583 and in the $1,000,000+ range at 546, while the under-$500,000 range had 181. These are current Active-only listing counts, not CREB Inventory and not a measure of months of supply by price range.
Taken together, the evidence points to several distinct patterns. The under-$500,000 range combined the strongest annual sales gain with the smallest current Active count. The $1,000,000+ range also showed stronger sales and higher new-listing inflow, alongside a comparatively large Active count. In the $600,000-$799,999 ranges, both sales and new-listing inflow were lower than a year earlier. The $800,000-$999,999 range was an exception within the upper-middle market: sales increased even as new listings declined sharply. Active counts should be read as current listing volume rather than relative market tightness because the ranges differ in market size and the report does not calculate segmented months of supply. Those contrasts are more useful than treating the detached market as one uniform price segment. That matters for interpretation: a large Active count can reflect the size of a segment as well as current supply, so it is descriptive listing evidence rather than a standalone measure of market balance.
| Price Range | Sales | Sales YoY | New Listings | New Listings YoY | Active Listings |
|---|---|---|---|---|---|
| Under $500,000 | 76 | +26.7% | 96 | +10.3% | 181 |
| $500,000-$599,999 | 184 | +6.4% | 305 | +4.5% | 507 |
| $600,000-$699,999 | 202 | -5.2% | 382 | -13.6% | 583 |
| $700,000-$799,999 | 149 | -6.3% | 299 | -25.1% | 468 |
| $800,000-$999,999 | 137 | +6.2% | 291 | -20.7% | 464 |
| $1,000,000+ | 148 | +19.4% | 335 | +7.0% | 546 |
Sources: Sales and Sales YoY are from CREB® City of Calgary Monthly Statistics. New Listings, New Listings YoY and Active Listings are derived from Pillar 9™ MLS® listing records. Active Listings are Active-only listing counts and are not official CREB Inventory.
Geographic Differences
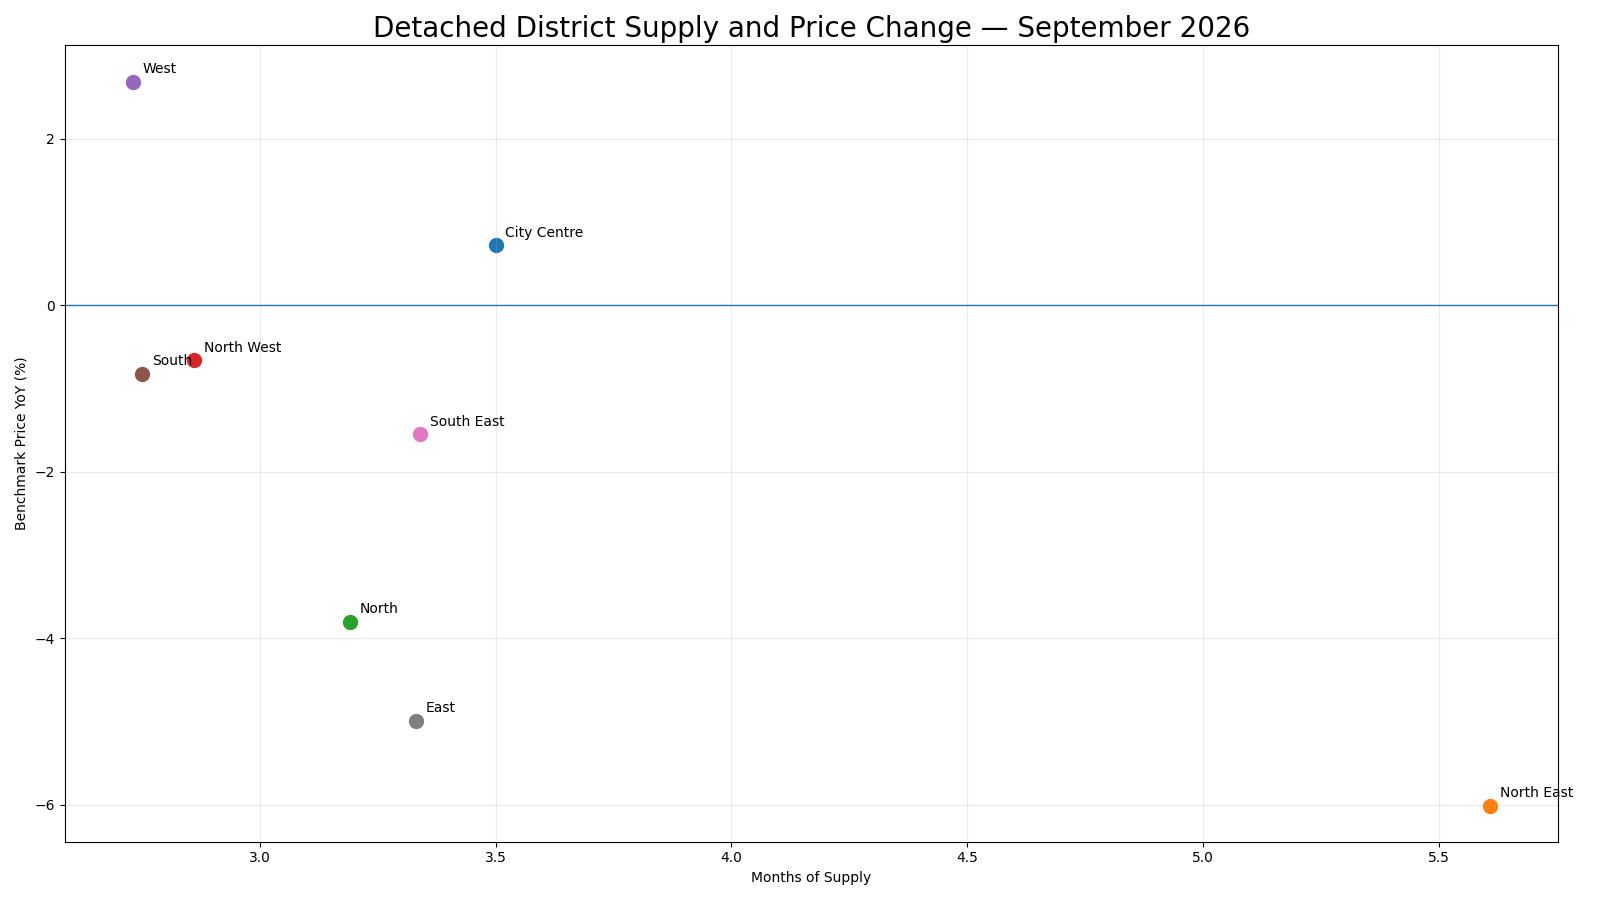
District conditions also varied materially. West had 2.73 months of supply and the strongest annual benchmark-price increase at 2.69%, while City Centre posted a 0.72% increase with 3.50 months of supply. North West and South were both below 3.00 months of supply, but their benchmark prices were slightly lower than a year earlier, at -0.66% and -0.82%. That difference shows that a similar supply position does not necessarily correspond to the same price outcome across districts.
North East stood apart with the highest months of supply at 5.61 and the largest annual benchmark decline at 6.01%. East recorded a 4.99% decline with 3.33 months of supply, while North was down 3.80% with 3.19 months. South East sat close to the citywide supply position at 3.34 months and had a 1.55% annual benchmark decline. South also recorded the highest district sales count at 202, while West had the smallest inventory among the larger districts at 232. The district evidence therefore ranges from positive annual price movement in West and City Centre to materially softer pricing in North East and East, reinforcing the importance of geographic comparables.
| District | Sales | Inventory | Months of Supply | Benchmark Price | Benchmark Price YoY |
|---|---|---|---|---|---|
| City Centre | 106 | 371 | 3.50 | $981,300 | 0.72% |
| North East | 88 | 494 | 5.61 | $556,600 | -6.01% |
| North | 138 | 440 | 3.19 | $640,200 | -3.80% |
| North West | 123 | 352 | 2.86 | $781,400 | -0.66% |
| West | 85 | 232 | 2.73 | $993,700 | 2.69% |
| South | 202 | 555 | 2.75 | $709,400 | -0.82% |
| South East | 119 | 398 | 3.34 | $698,900 | -1.55% |
| East | 33 | 110 | 3.33 | $476,200 | -4.99% |
Source: CREB® City of Calgary Monthly Statistics, September 2026.
What Is Driving the Detached Market
The strongest internal explanation for September's overall balance is the relationship between sales and available supply. Citywide detached sales were higher than a year earlier while both new listings and inventory were lower. That combination reduced months of supply to 3.31 and kept the overall market inside the governed balanced range. At the same time, the benchmark price remained slightly below September 2025, indicating that the tighter sales-to-supply relationship has not produced uniform upward price movement.
The segmented evidence explains why. Sales strength was concentrated under $500,000 and at $1,000,000+, while the $600,000-$799,999 ranges were weaker. New-listing inflow also contracted sharply through $600,000-$999,999, so the composition of current activity differs by price range. Geographic conditions are similarly uneven: West combined relatively low supply with positive annual price movement, while North East had much higher supply and a larger price decline. Market status is classified only at the citywide Detached level, so these segment differences describe variation rather than separate buyer's or seller's markets. Together, the relationships help explain how Calgary can remain balanced overall while individual price ranges and districts deliver different transaction experiences.
What This Means for Buyers and Sellers
For buyers, the September evidence suggests that the amount of choice and the intensity of competition can vary substantially depending on price range and location. Citywide, 3.31 months of supply indicates a balanced detached market rather than an overall shortage or surplus. Within that total, however, sales under $500,000 were up 26.7% from a year earlier and that range had the smallest current Active count in the price-range table. Other ranges, particularly $600,000-$799,999, had lower year-over-year sales. District supply also ranged from 2.73 months in West to 5.61 months in North East. Those differences make current segment-specific comparables more informative than the citywide benchmark alone when assessing competition and negotiating context.
For sellers, the same divergence increases the importance of positioning a property against the evidence for its actual segment. The citywide benchmark was down only 0.95% year over year, but district benchmark changes ranged from a 2.69% increase in West to a 6.01% decline in North East. Price-range activity also varied, with stronger sales at the lower end and above $1,000,000 but weaker sales through $600,000-$799,999. Current Active counts were relatively large in several mid-to-upper ranges, although those counts are not directly comparable with CREB Inventory or months of supply. A property can therefore face a different competitive set from the headline citywide result even when the overall market remains balanced. Expectations around exposure time, pricing sensitivity and negotiating leverage should be grounded in recent comparable activity for the relevant district and price range rather than inferred from the citywide result alone.
What to Watch Next
The first relationship to watch is whether inventory remains near 3,000 while sales hold around current levels. A sustained decline in inventory with stable or rising sales would reduce months of supply and increase competitive pressure; rising inventory without a matching lift in sales would move the balance the other way.
Price-range activity also matters. Watch whether the sales gains under $500,000 and at $1,000,000+ persist, and whether the $600,000-$799,999 ranges recover from their year-over-year declines. Changes in new-listing inflow through $600,000-$999,999 will help show whether current supply patterns are broadening or tightening.
Finally, monitor district months of supply alongside benchmark-price change. A narrowing gap between higher-supply areas such as North East and lower-supply districts such as West would indicate that geographic divergence is easing; a widening gap would make district-specific comparables even more important.
Explore the Market in More Detail
Sources and Methodology
Official CREB® City of Calgary Monthly Statistics are used for the citywide Detached benchmark price, sales, new listings, inventory, months of supply, the 13-month activity series, price-range sales and all district measures in this report.
Pillar 9™ MLS® listing records are used only for price-range New Listings, New Listings year-over-year calculations and current Active Listings. Active Listings are records with MlsStatus = Active and are not the same measure as official CREB Inventory. Price-range sales remain official CREB values.
The citywide Detached market status is based on official months of supply: below 2.5 months is a Seller's Market, 2.5 to 4.0 months is a Balanced Market, and above 4.0 months is a Buyer's Market. No separate market-status classification is assigned to price ranges or districts.