
June 2026 left Calgary's detached market in a seller's market overall, with 2.49 months of supply and sales slightly above the same month last year. The headline balance, however, masks meaningful differences by price range and district. This report follows the 13-month supply-and-demand trajectory, then examines where sales activity, new listing flow and current active supply are diverging.
Executive Summary
Calgary's detached market finished June 2026 in a seller's market overall, with 2.49 months of supply. Sales reached 1,202, 0.84% above June 2025, while New Listings were 6.86% lower and Inventory was 3.86% lower. That combination left the market slightly tighter than a year earlier even though the $750,500 benchmark price remained 1.42% below June 2025. Through the first half of 2026, sales recovered steadily from the December low and inventory rebuilt, but supply did not return to the level recorded a year earlier.
The city-wide result conceals clear segmentation. Official CREB sales rose most sharply below $500,000, increased modestly from $500,000-$599,999 and at $1 million or more, and declined across much of the $600,000-$799,999 range. Listing-level evidence shows relatively few current Active Listings below $500,000 and larger pools of active supply in several middle and upper ranges. Districts also vary widely: Months of Supply ranges from 1.90 in the West to 4.13 in the North East, while benchmark-price changes range from +3.72% in the West to -6.80% in the North East.
The practical implication is that the overall seller's-market label describes the detached segment in aggregate, not every price range or district. Buyers and sellers should interpret competition through the most relevant price-band and geographic comparables. The next material signals are whether inventory continues to rebuild relative to sales, whether the year-over-year shortfall in New Listings persists, and whether the current price-range and district differences narrow or widen.
Detached Market at a Glance
Source: CREB® City of Calgary Monthly Statistics, June 2026.
How the Detached Market Is Changing
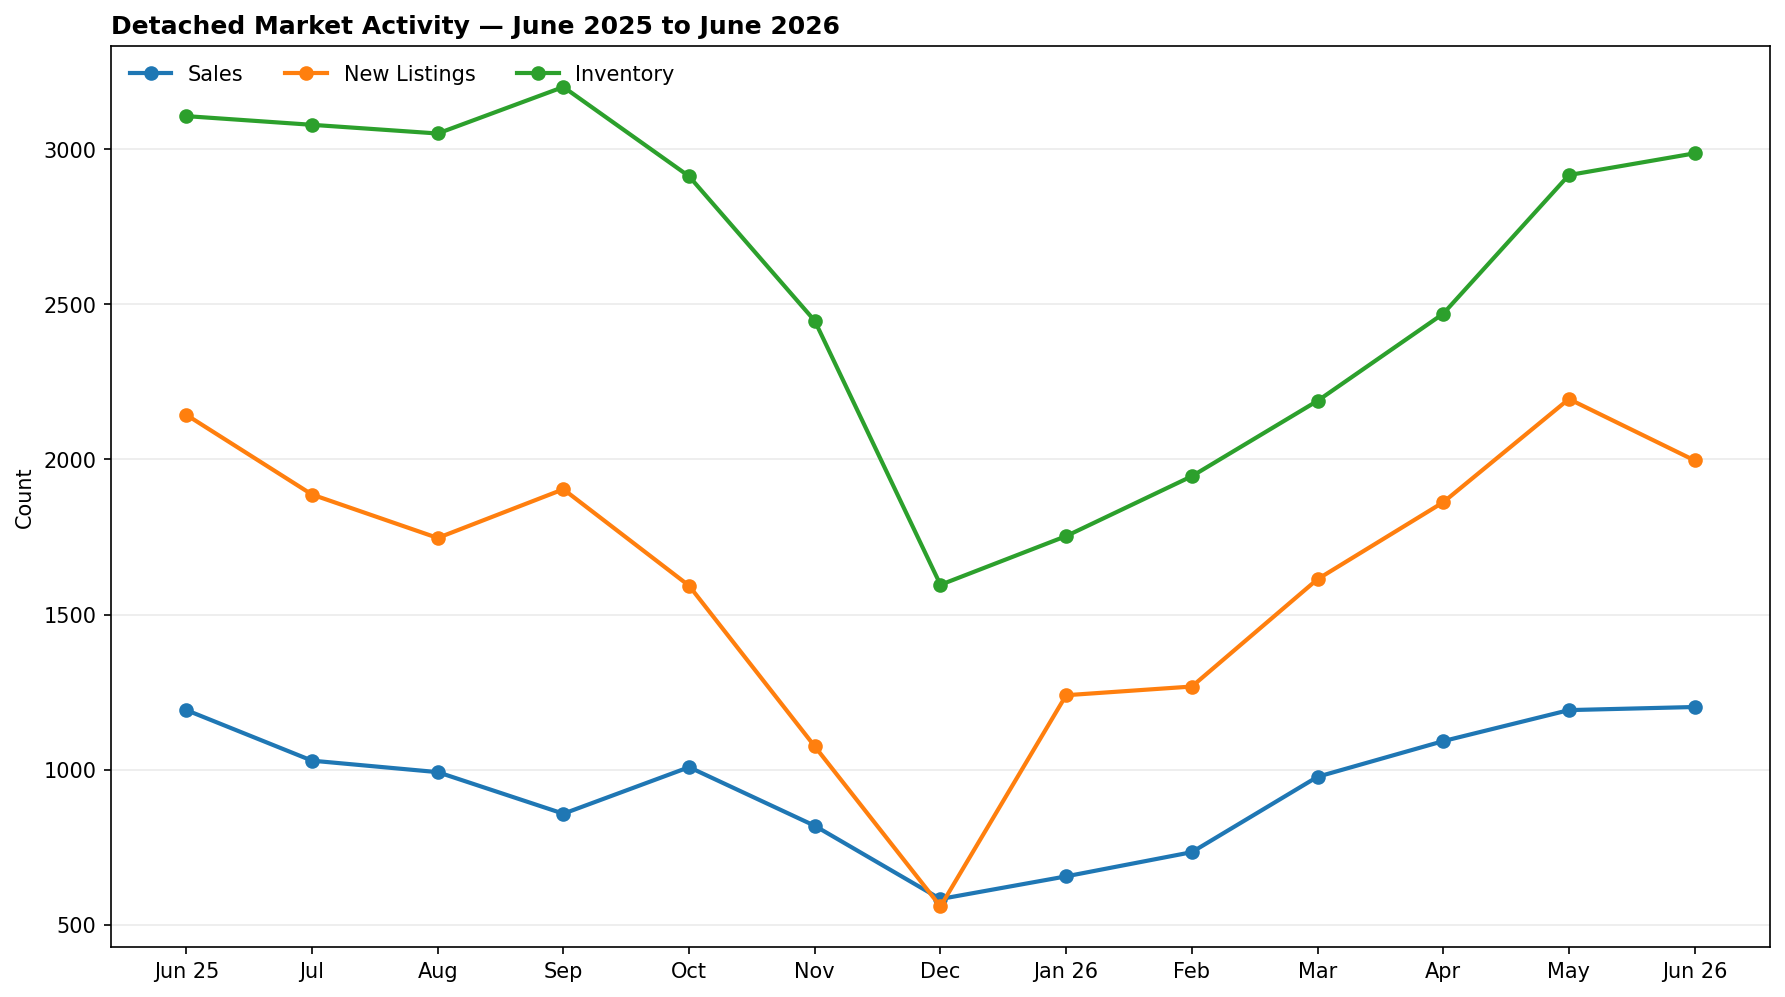
Calgary detached activity strengthened steadily through the first half of 2026 after the seasonal low at the end of 2025. Sales fell from 1,192 in June 2025 to 583 in December, then increased every month from January through June: 656 in January, 734 in February, 977 in March, 1,092 in April, 1,192 in May and 1,202 in June. The June total was 0.84% above a year earlier, so the recovery in spring activity brought sales back to roughly the level seen at the start of the 13-month window rather than creating a large year-over-year expansion.
New Listings followed a different path. They declined sharply into December, rebounded to 1,240 in January and continued rising to 2,195 in May before easing to 1,997 in June. June's inflow was 6.86% below June 2025. Inventory also rebuilt through the spring, increasing from 1,596 in December to 2,987 in June, but remained 3.86% below the 3,107 listings reported a year earlier. That combination matters: sales were slightly higher year over year while both new supply and total inventory were lower.
The resulting Months of Supply was 2.49 in June, down 4.66% from 2.61 a year earlier and just inside the governed seller's-market threshold. The benchmark price was $750,500, 1.42% below June 2025. Taken together, the trajectory shows a market that became more competitive through the first half of 2026 as sales recovered faster than available supply rebuilt. At the same time, the lower year-over-year benchmark price shows that tighter current balance has not translated into uniform annual price appreciation. The direction of activity and supply is therefore stronger than the year-over-year price result alone would suggest. The June pattern therefore combines restored transaction momentum with a supply base that remains more constrained than last summer, which is the core competitive signal in the 13-month series.
Where the Detached Market Is Diverging
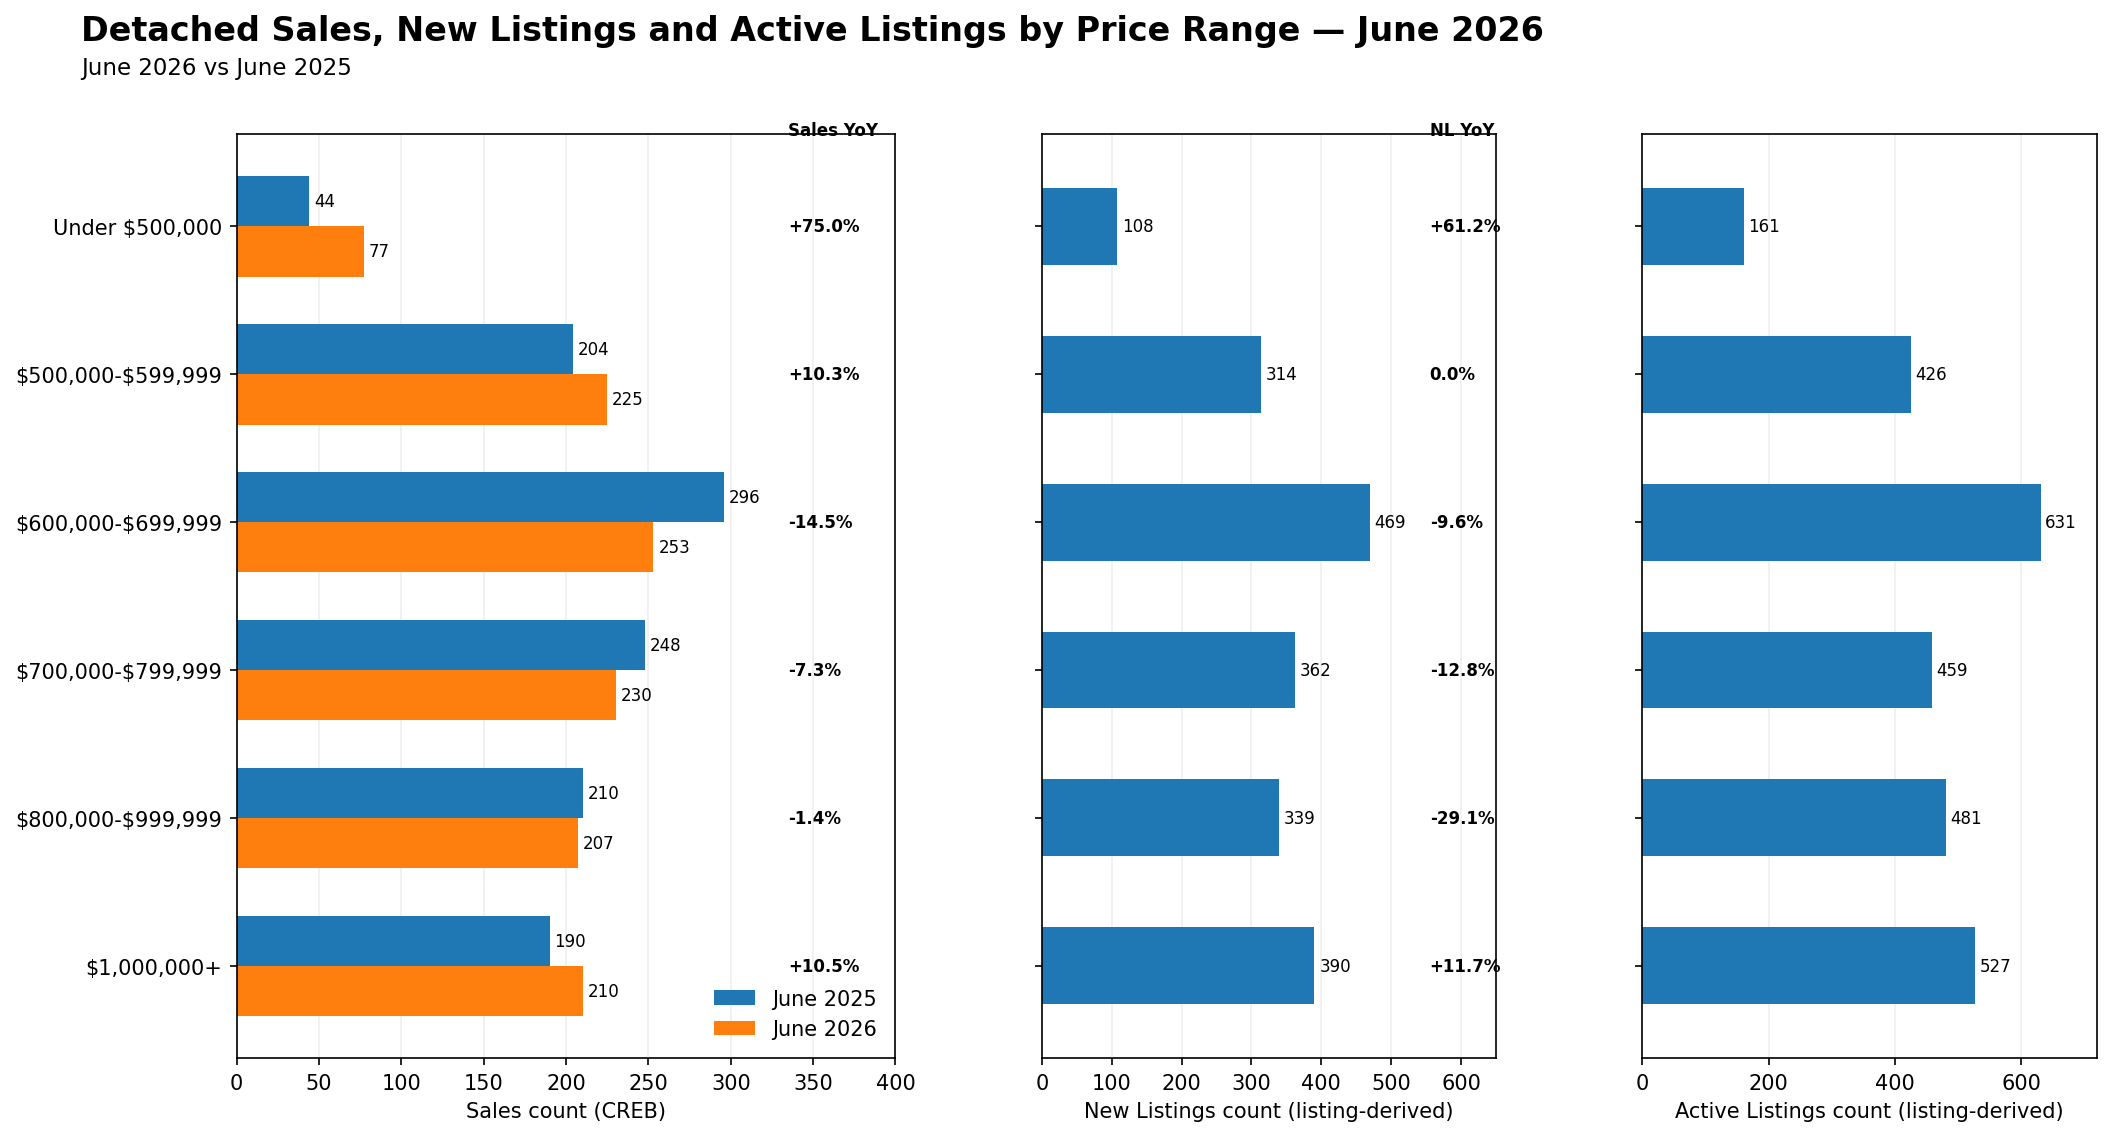
Price-range evidence shows that the improvement in detached sales was not evenly distributed. The strongest year-over-year sales gain occurred below $500,000, where official CREB sales increased from 44 to 77, a 75.0% rise. Sales also increased in the $500,000-$599,999 band, up 10.3%, and at $1,000,000 or more, up 10.5%. By contrast, sales declined 14.5% in the $600,000-$699,999 range and 7.3% in the $700,000-$799,999 range. The $800,000-$999,999 segment was nearly unchanged at -1.4%.
The listing-level New Listings evidence adds a second dimension. Below $500,000, New Listings rose 61.2% from the same month last year, reinforcing the increase in sales activity in the lowest governed band. At $500,000-$599,999, New Listings were unchanged year over year even as sales increased. In the $600,000-$999,999 span, New Listings fell across all three bands, including a 29.1% decline at $800,000-$999,999. At $1,000,000 or more, New Listings increased 11.7%, broadly alongside the increase in sales.
Current Active Listings remain substantial in the middle and upper ranges. The largest Active-only count was 631 in the $600,000-$699,999 band, followed by 527 at $1,000,000 or more and 481 from $800,000-$999,999. The under-$500,000 band had only 161 Active Listings despite the largest sales growth. These counts are not the official CREB Inventory measure and should be read as current listing-level supply within each price band. The overall pattern is a market with strong activity at the low end and renewed activity at the high end, while several middle price ranges show softer sales versus last year despite meaningful current choice. That split matters because the detached market is not moving in one direction across the price spectrum: buyer activity, new listing flow and the current depth of available listings are producing different conditions by band.
| Price Range | Sales | Sales YoY | New Listings | New Listings YoY | Active Listings |
|---|---|---|---|---|---|
| Under $500,000 | 77 | +75.0% | 108 | +61.2% | 161 |
| $500,000-$599,999 | 225 | +10.3% | 314 | 0.0% | 426 |
| $600,000-$699,999 | 253 | -14.5% | 469 | -9.6% | 631 |
| $700,000-$799,999 | 230 | -7.3% | 362 | -12.8% | 459 |
| $800,000-$999,999 | 207 | -1.4% | 339 | -29.1% | 481 |
| $1,000,000+ | 210 | +10.5% | 390 | +11.7% | 527 |
Sales and Sales YoY are official CREB® measures. New Listings, New Listings YoY and Active Listings are derived from the supplied Pillar 9™ MLS® records. Active Listings is an Active-only listing count, excludes Pending, and is not the official CREB Inventory measure.
Geographic Differences
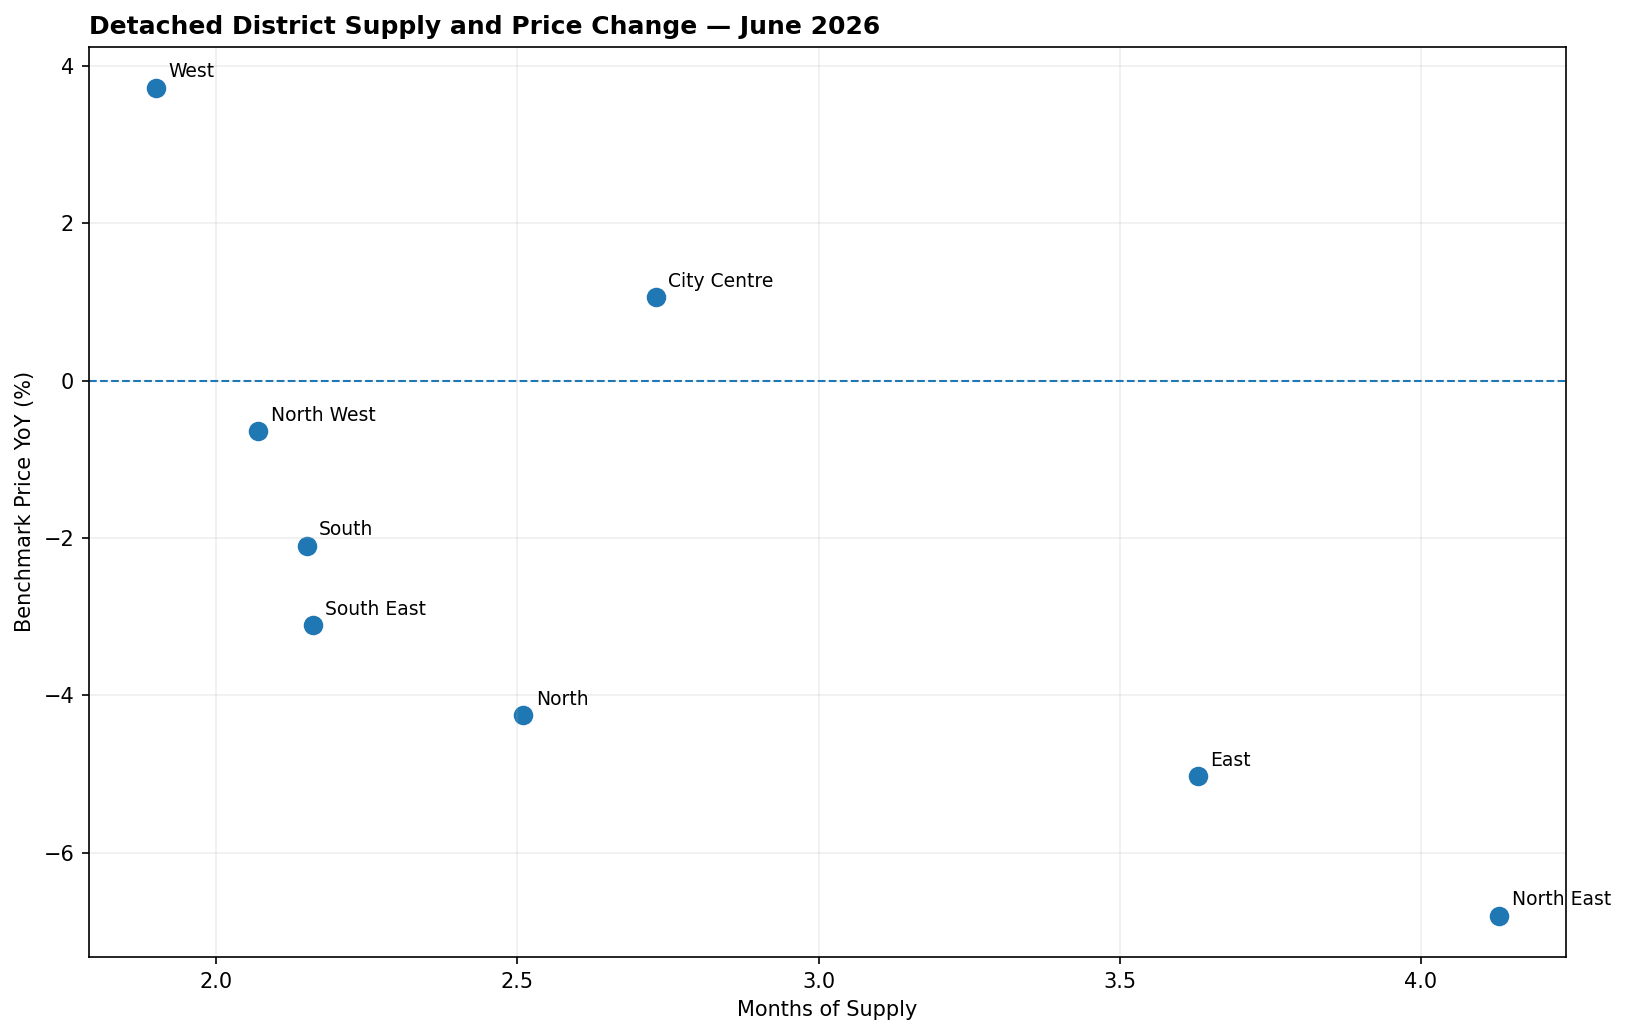
District conditions also differ materially. Months of Supply ranged from 1.90 in the West district to 4.13 in the North East. The North West, South and South East were also relatively tight at 2.07, 2.15 and 2.16 months respectively, while the East stood at 3.63 and the North East had the highest supply position. Sales volume was concentrated most heavily in the South with 243 transactions, followed by the South East with 201. The spread is large enough to materially change local context.
Benchmark-price movement did not follow one city-wide pattern. The West posted the strongest year-over-year increase at 3.72%, and City Centre was up 1.06%. All six other districts were lower than a year earlier, led by declines of 6.80% in the North East, 5.03% in the East and 4.25% in the North. These are descriptive contrasts rather than district market-state classifications, and the chart does not imply that Months of Supply caused the price changes. The practical conclusion is that detached conditions vary enough geographically that city-wide balance should be supplemented with district-level evidence when evaluating comparable properties.
| District | Sales | Inventory | Months of Supply | Benchmark Price | Benchmark Price YoY |
|---|---|---|---|---|---|
| City Centre | 134 | 366 | 2.73 | $996,800 | 1.06% |
| North East | 127 | 524 | 4.13 | $560,700 | -6.80% |
| North | 173 | 434 | 2.51 | $651,600 | -4.25% |
| North West | 168 | 348 | 2.07 | $791,500 | -0.64% |
| West | 121 | 230 | 1.90 | $1,025,000 | 3.72% |
| South | 243 | 523 | 2.15 | $724,100 | -2.10% |
| South East | 201 | 434 | 2.16 | $700,800 | -3.11% |
| East | 32 | 116 | 3.63 | $489,400 | -5.03% |
What Is Driving the Detached Market
The internal mechanics point to a market in which recovering demand has met a supply base that rebuilt through the spring but remained below last year's June level. Sales finished slightly above June 2025, while New Listings and Inventory finished below it. That relationship lowered Months of Supply to 2.49 and produced a seller's-market classification for the detached segment overall. The competitive shift is therefore coming from the relative movement of sales and available supply, not from a large increase in transaction volume alone.
Price-range and district evidence show why that overall classification cannot describe every situation equally well. Sales growth is concentrated below $600,000 and at $1 million or more, while the $600,000-$799,999 ranges recorded weaker year-over-year sales. Current Active Listings are also much more numerous in several middle and upper bands than below $500,000. Geographically, supply positions range widely and benchmark-price changes span positive and negative territory. These differences mean that the city-wide market balance is an aggregate outcome: competition is being shaped by where buyer activity is strongest relative to the listings available in each segment, while pricing outcomes remain uneven across both price ranges and districts.
What This Means for Buyers and Sellers
For buyers, the city-wide seller's-market reading means that overall detached supply remains tight relative to recent sales, but the price-range evidence argues against assuming the same level of competition everywhere. Below $500,000, sales increased sharply and the current Active-only count is comparatively small, so buyers in that band may encounter fewer available options relative to the level of activity. In several middle ranges, sales were lower than a year earlier while Active Listings counts remain larger, which can create more room to compare properties and focus closely on condition, location and pricing. At $1 million or more, both sales and New Listings increased, so the segment is active on both sides of the market rather than simply supply-constrained.
For sellers, the key implication is that the overall market classification is not a substitute for segment-specific comparables. Properties compete most directly with other detached listings in a similar price range and location. The district evidence reinforces that point: benchmark-price changes ranged from gains in the West and City Centre to larger annual declines in the North East and East, while Months of Supply also varied considerably. A pricing strategy anchored only to the city-wide benchmark or overall seller's-market label may miss the conditions facing the property's closest alternatives.
For both sides, current evidence supports a more granular reading of market leverage. Buyers can use the depth of Active Listings and recent sales in the relevant band to judge how much choice exists, while sellers can use the same evidence to assess how readily comparable inventory may compete for attention. These are market-level implications rather than individualized advice; property condition, micro-location and the quality of direct comparables remain important to any specific transaction.
What to Watch Next
The first relationship to watch is whether sales continue to hold near current levels while Inventory rises further. A sustained increase in Inventory without comparable sales growth would lift Months of Supply and reduce the current competitive pressure; continued sales strength with limited inventory growth would do the opposite. Second, watch whether New Listings continue to fall year over year, because a persistent shortfall would constrain the pace at which buyer choice can rebuild.
Price-range divergence is the third signal. If the strong sales gains below $600,000 broaden into the $600,000-$799,999 ranges, the current split in activity would narrow; if those middle bands remain weaker, segment differences would stay important. Finally, monitor whether district benchmark-price changes become more consistent across Calgary. A narrowing spread between the strongest and weakest districts would indicate a more uniform market, while a wider spread would make local comparable evidence even more important.
Explore the Market in More Detail
Sources and Methodology
Headline Detached measures, the 13-month Sales/New Listings/Inventory series, price-range Sales and district statistics are from CREB® City of Calgary Monthly Statistics. Market Status is determined from the official Detached Months of Supply using the report's fixed city-wide thresholds.
Price-range New Listings and New Listings YoY are calculated from supplied Pillar 9™ MLS® records using Original List Price. Price-range Active Listings are a current Active-only count using Current Price; Pending listings are excluded. These Active Listings counts are not the official CREB Inventory measure. Listing-level Sold and New Listing totals are used only as diagnostic source-reconciliation evidence and do not replace official CREB values.
The supplied historical listing extraction does not contain retained upstream query-count or truncation evidence, so completeness of the upstream Pillar 9 database is not independently certified. The supplied analytical listing record set was validated for identity, required fields, duplicate Listing IDs, required monthly cohorts, valid qualifying dates/prices and exact price-band assignment.