
The July 2026 Calgary Detached Monthly Market Report examines the city-wide balance of sales and supply, the 13-month trajectory, price-range differences and district-level variation. Official CREB® statistics anchor published market measures, while listing-level records are used only for the governed price-range New Listings and current Active Listings counts needed to add segment detail.
Executive Summary
Calgary’s Detached market remained balanced in July 2026, but that city-wide classification masks meaningful differences by price range and district. Official CREB® statistics recorded a benchmark price of $743,900, 1.87% below July 2025. Sales were 1,012, down 1.65% year over year, while New Listings fell 9.54% to 1,707 and Inventory declined 4.55% to 2,939. Months of Supply was 2.90, keeping the market within the governed Balanced Market range.
The 13-month trajectory shows supply expanding from the winter low into spring and early summer, while sales also strengthened before both activity and new listing flow eased in July. Price-range results were less uniform. Sales below $500,000 rose sharply from a year earlier and $1,000,000+ also increased, while the $600,000-$999,999 ranges recorded declines. Listing-derived Active counts were largest in the $600,000-$699,999 and $1,000,000+ bands, indicating that current choice is distributed unevenly across the market.
District evidence was similarly mixed. The West recorded the lowest Months of Supply and the strongest positive benchmark-price change, while the North East and East had the highest supply readings and negative annual benchmark changes. For buyers and sellers, the main implication is that the city-wide balanced reading is useful context but not a complete description of competitive conditions. Price range, district and the immediate set of comparable properties remain important to interpreting the July evidence.
Detached Market at a Glance
Source: CREB® City of Calgary Monthly Statistics, July 2026. Market Status is derived only from official Detached Months of Supply.
How the Detached Market Is Changing
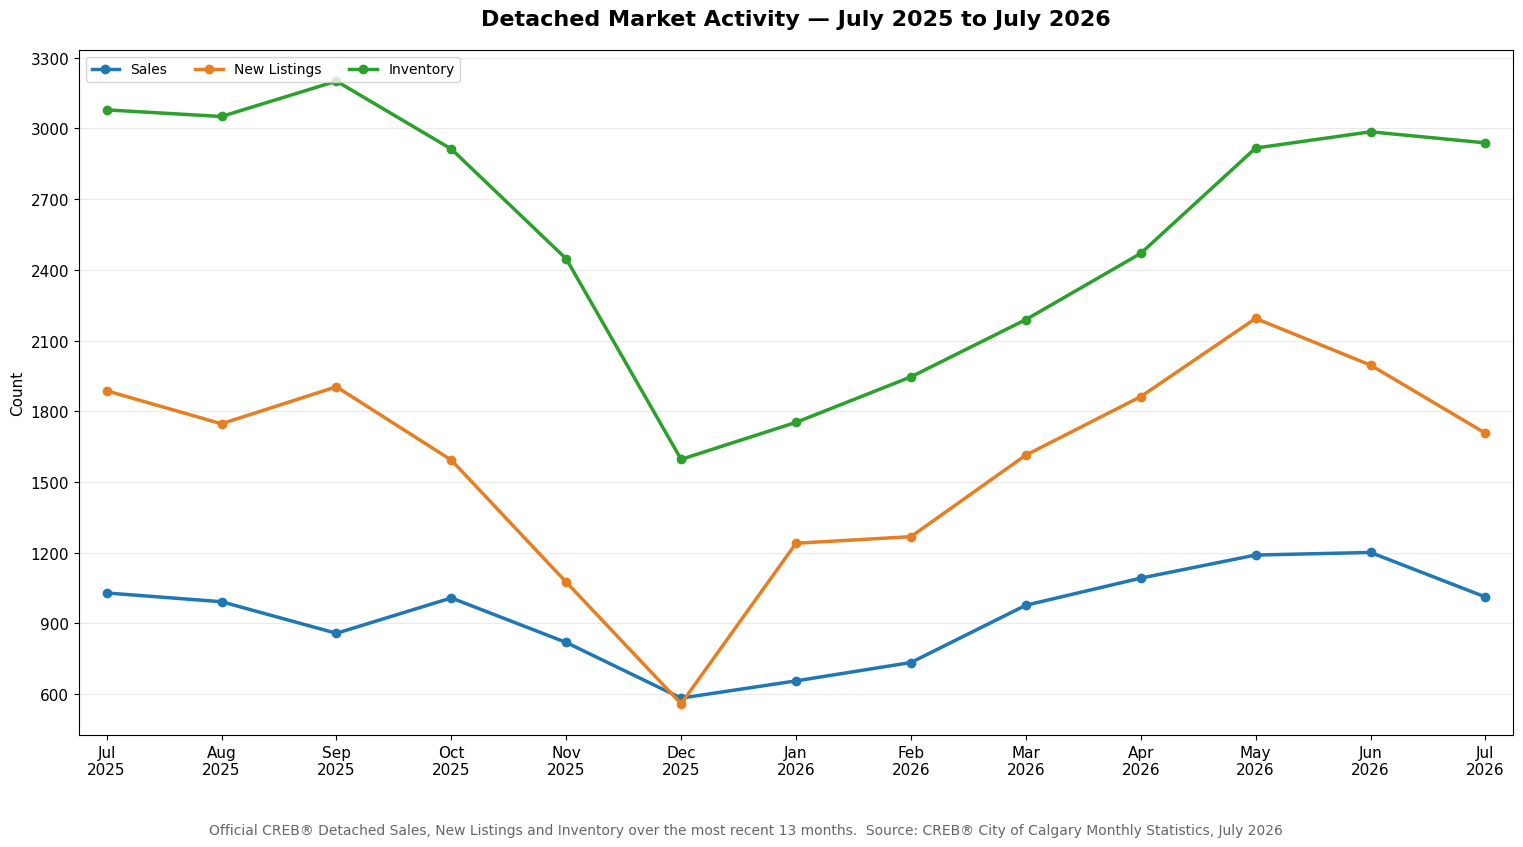
Calgary’s Detached market moved into July after a strong spring build in both activity and supply, but the month itself marked a pullback from June. Sales rose from 656 in January to 1,201 in June before easing to 1,012 in July. New Listings followed a similar seasonal expansion, climbing from 1,240 in January to a May high of 2,194, then moderating to 1,996 in June and 1,707 in July. Inventory increased steadily from 1,596 in December 2025 to 2,986 in June, then edged lower to 2,939 in July.
Against July 2025, the change was more restrained than the spring-to-summer sequence might suggest. July Sales were 1.65% lower year over year, while New Listings were down 9.54% and Inventory was down 4.55%. Because new supply declined more sharply than sales on that comparison, the official Months of Supply measure was 2.90, 2.94% below the 2.99 recorded one year earlier. That places the overall Detached market in the governed Balanced Market range rather than indicating a broad shift toward either extreme of the market-status framework.
The 13-month relationship therefore has two parts. Supply expanded materially from the winter low as the 2026 selling season developed, giving buyers more listings to evaluate than were available around year-end. At the same time, sales also strengthened into early summer, absorbing enough of that additional supply to keep July Months of Supply close to last year’s level. The small June-to-July inventory decline, combined with a larger monthly decline in New Listings, shows that the late-summer supply path is no longer simply one of continuous accumulation. The next readings will matter for determining whether the spring inventory build resumes or continues to level off. July therefore ended with a market that had more supply than winter, but without a clear broad acceleration in inventory at month-end.
Where the Detached Market Is Diverging
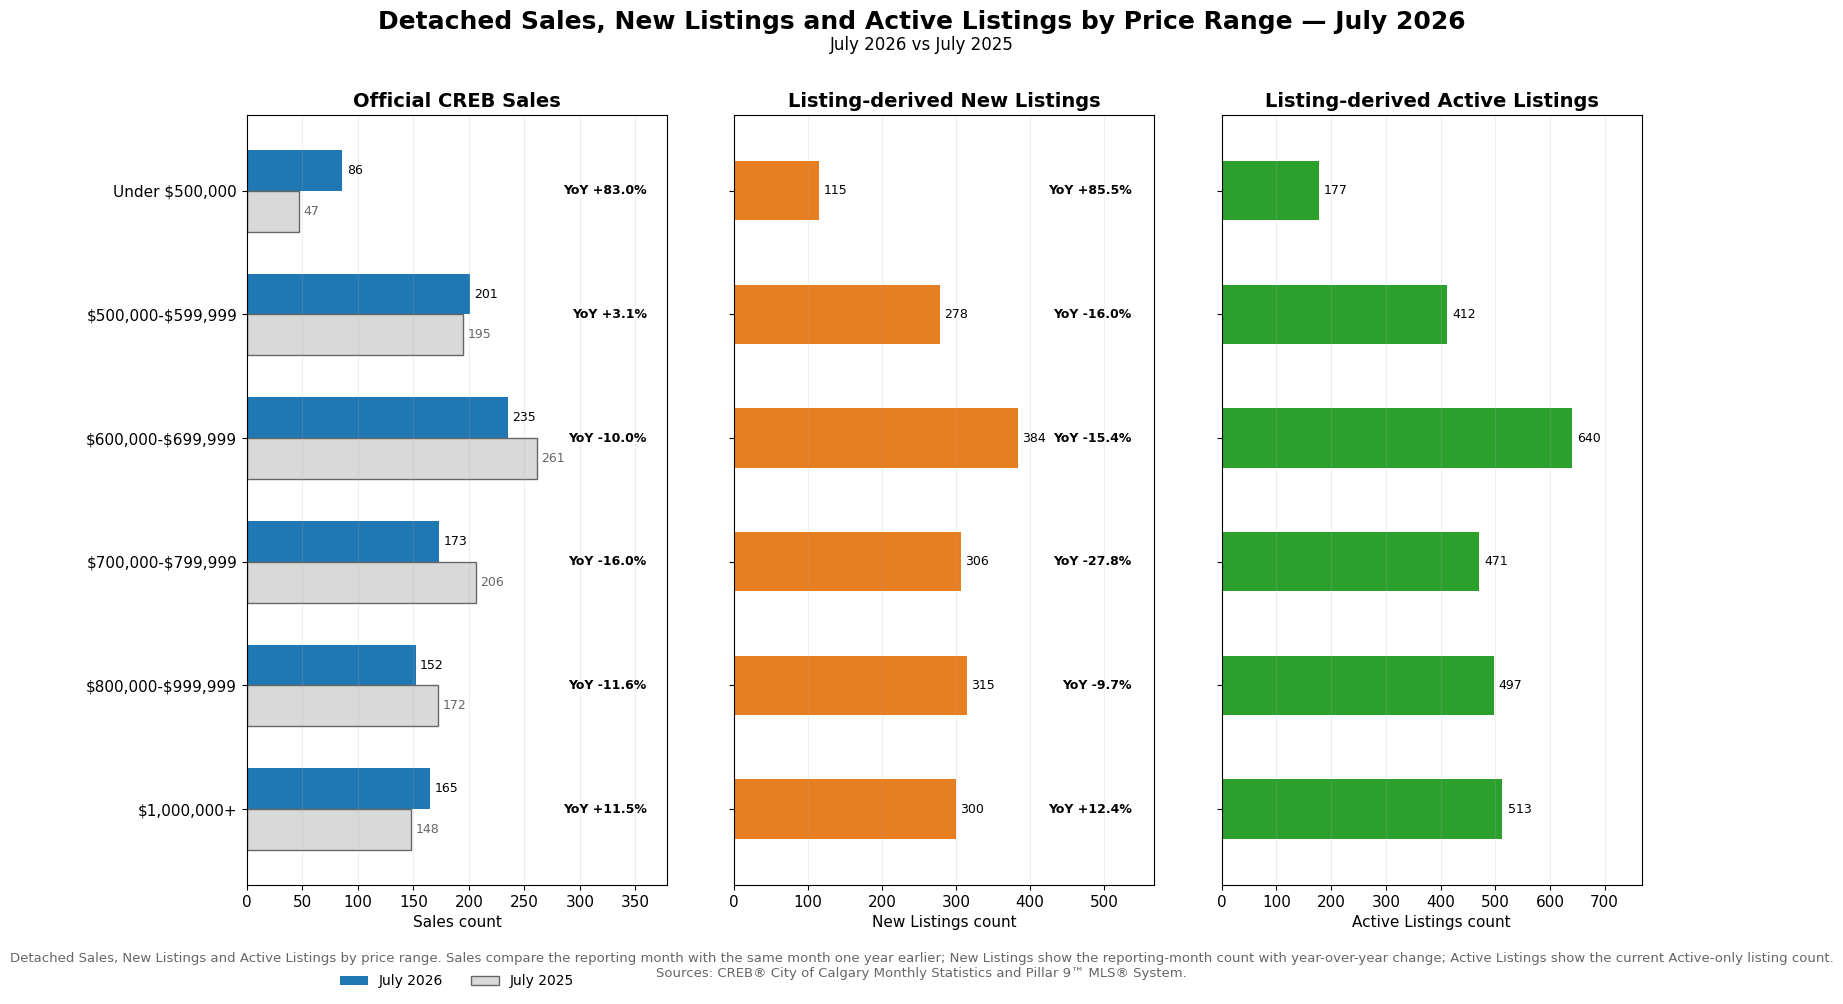
Price-range results were notably uneven in July. Official CREB Sales below $500,000 reached 86, up 83.0% from 47 a year earlier. The $500,000-$599,999 range was comparatively stable at 201 Sales, up 3.1%. By contrast, the three ranges from $600,000 through $999,999 all recorded fewer Sales than in July 2025: $600,000-$699,999 was down 10.0%, $700,000-$799,999 was down 16.0%, and $800,000-$999,999 was down 11.6%. At $1,000,000 and above, Sales increased 11.5% to 165.
The listing-derived New Listings counts show a similar split at the ends of the price spectrum, but not an identical one. Under $500,000, 115 New Listings were recorded, up 85.5% year over year. At $1,000,000 and above, 300 New Listings were up 12.4%. New Listings declined in each of the four intervening bands, with the largest decrease in the $700,000-$799,999 range at 27.8%. These counts help explain where fresh listing flow was expanding or contracting, without replacing CREB’s official Sales evidence.
Current Active Listings add a different view of available choice. The largest Active count was in the $600,000-$699,999 range at 640, followed by $1,000,000+ at 513 and $800,000-$999,999 at 497. The under-$500,000 range had 177 Active Listings despite the sharp annual increase in Sales. Taken together, the evidence points to stronger sales momentum at the lowest governed band and at the $1,000,000+ band, while several mid-to-upper ranges carried substantial current Active supply alongside weaker year-over-year Sales. These are segment contrasts, not separate market-state classifications. The contrast is also important because a similar city-wide sales total can be produced by very different movements underneath it. July’s gains at the lowest and highest governed bands offset softer activity through much of the middle, so the aggregate result alone would conceal where demand was actually strengthening and where current listing choice was more substantial.
| Price Range | Sales | Sales YoY | New Listings | New Listings YoY | Active Listings |
|---|---|---|---|---|---|
| Under $500,000 | 86 | +83.0% | 115 | +85.5% | 177 |
| $500,000-$599,999 | 201 | +3.1% | 278 | -16.0% | 412 |
| $600,000-$699,999 | 235 | -10.0% | 384 | -15.4% | 640 |
| $700,000-$799,999 | 173 | -16.0% | 306 | -27.8% | 471 |
| $800,000-$999,999 | 152 | -11.6% | 315 | -9.7% | 497 |
| $1,000,000+ | 165 | +11.5% | 300 | +12.4% | 513 |
Sales and Sales YoY are official CREB® measures. New Listings, New Listings YoY and Active Listings are derived from the supplied Pillar 9™ MLS® records. Active Listings includes Active status only, excludes Pending, and is not official CREB Inventory.
Geographic Differences
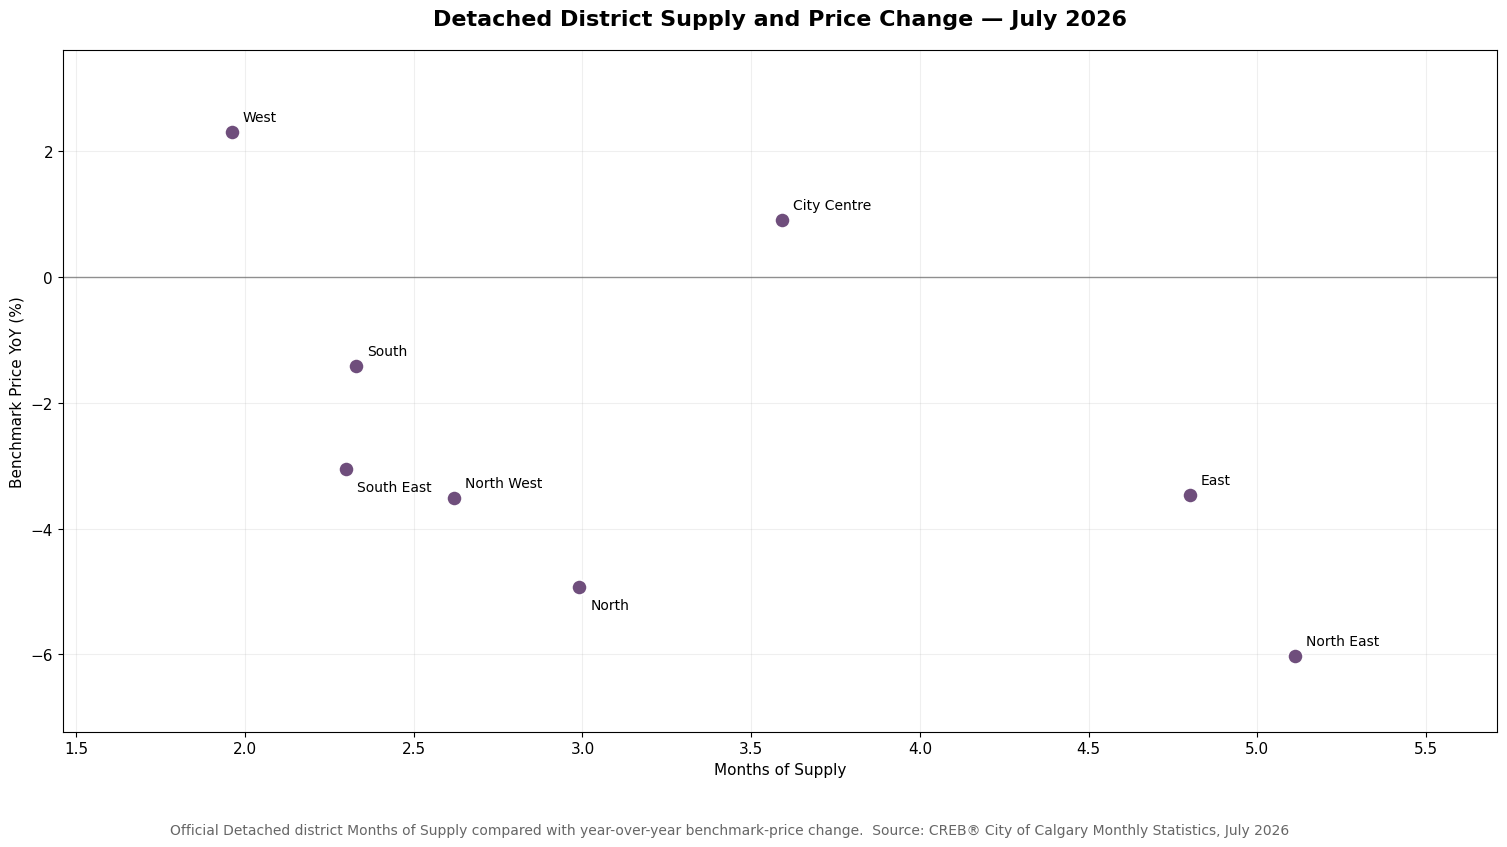
Detached conditions also differed materially across Calgary’s districts. Official Months of Supply ranged from 1.96 in the West to 5.11 in the North East, with the East also elevated at 4.80. Benchmark-price movement was strongest in the West, up 2.31% year over year, while City Centre was also positive at 0.91%. The remaining districts recorded annual benchmark declines, led by the North East at 6.03% and the North at 4.93%.
Sales volume was concentrated most heavily in the South, with 218 transactions, and the South East, with 173. Inventory was highest in the North East at 531 and the South at 509. The scatter view shows that districts with more available supply often occupied a weaker price-change position in July, but the relationship is not uniform and should not be read as proof that supply caused the benchmark movement. City Centre, for example, combined 3.59 Months of Supply with a modest positive annual benchmark change, while the West combined the lowest supply reading with the strongest positive change. The district spread therefore remained wide enough that neighbourhood-level evidence could differ materially from the city-wide average even within the same property subtype.
| District | Sales | Inventory | Months of Supply | Benchmark Price | Benchmark Price YoY |
|---|---|---|---|---|---|
| City Centre | 103 | 370 | 3.59 | $992,000 | +0.91% |
| North East | 104 | 531 | 5.11 | $563,900 | -6.03% |
| North | 146 | 437 | 2.99 | $647,700 | -4.93% |
| North West | 135 | 354 | 2.62 | $770,600 | -3.52% |
| West | 107 | 210 | 1.96 | $1,003,800 | +2.31% |
| South | 218 | 509 | 2.33 | $719,500 | -1.42% |
| South East | 173 | 398 | 2.30 | $698,900 | -3.05% |
| East | 25 | 120 | 4.80 | $490,200 | -3.47% |
Source: CREB® City of Calgary Monthly Statistics, July 2026.
What Is Driving the Detached Market
The July balance is best understood through the interaction of sales, incoming listings and the stock already available. City-wide, Sales were only modestly below last July, while New Listings fell more sharply. That helped keep official Months of Supply at 2.90 even though the market carried far more inventory than it did during the winter low. In other words, the spring supply expansion increased choice, but sales activity remained strong enough that the overall Detached market still sat within the balanced range.
The price-range evidence shows why the city-wide average cannot describe every segment. Sales strengthened sharply below $500,000 and rose at $1,000,000+, while several middle and upper ranges posted annual declines and also held some of the largest Active listing counts. Geographic evidence adds another layer: supply and benchmark-price movement varied widely by district, with the West and City Centre in positive annual price territory while higher-supply North East and East sat in negative territory. Together, those relationships indicate a market whose aggregate balance is being produced by offsetting segment conditions rather than uniform behaviour across price ranges and locations.
What This Means for Buyers and Sellers
For buyers, the Balanced Market classification means the Detached market as a whole is not showing the broad supply scarcity associated with the governed seller’s-market range, but the amount of choice depends heavily on price range and district. The $600,000-$699,999, $800,000-$999,999 and $1,000,000+ ranges each carried comparatively large Active listing counts in July. In areas such as the North East and East, official Months of Supply was also materially above the city-wide reading. Those conditions can translate into more properties to compare and greater importance of evaluating how a specific listing fits its immediate competitive set.
For sellers, July’s evidence reinforces the importance of segment-specific comparables rather than relying on the city-wide benchmark alone. Sales below $500,000 were much stronger than a year earlier, while sales in several higher price bands declined. District benchmark changes also ranged from gains in the West and City Centre to declines elsewhere. A property entering a segment with more Active competition or weaker recent sales may face a different response than one in a segment where sales activity has strengthened.
Neither side should interpret the aggregate Balanced Market label as a guarantee of a particular negotiation outcome. It is a summary of the official city-wide Months of Supply measure. The report’s price-range and district evidence shows that exposure to competition, available choice and pricing sensitivity can differ meaningfully across Calgary. The practical implication is that expectations should be anchored to the relevant property characteristics, price range and location, while keeping the city-wide trend as context rather than treating it as a substitute for the local evidence.
What to Watch Next
City-wide balance: watch official Detached Months of Supply. A sustained move below 2.5 or above 4.0 would change the governed market-state classification and would signal a materially different relationship between available supply and sales.
Supply flow: watch whether New Listings continue to ease after the May peak and whether Inventory resumes rising or continues to level off. A renewed inventory build without comparable sales growth would expand buyer choice; continued supply moderation with firm sales would do the opposite.
Segment divergence: watch whether the $600,000-$999,999 sales declines persist relative to their Active listing counts, and whether the West, North East and East retain their current district supply and benchmark-price positions. Convergence would make the city-wide reading more representative; widening gaps would increase the importance of segment-specific interpretation.
Explore the Market in More Detail
Sources and Methodology
Official CREB® City of Calgary monthly statistics are the authoritative source for the Detached benchmark price, Sales, New Listings, Inventory, Months of Supply, the 13-month city-wide series, price-range Sales and district measures used in this report. The market-status label is derived only from the official city-wide Detached Months of Supply using the report’s fixed thresholds.
Price-range New Listings, New Listings year-over-year changes and current Active Listings are calculated from the supplied Pillar 9™ MLS® listing records. New Listings are grouped by Original List Price, while current Active Listings are grouped by Current Price and include Active status only; Pending listings are excluded. These Active listing counts are not the same measure as official CREB Inventory.
The supplied listing record set did not include retained upstream extraction counts or truncation evidence, so this report does not claim independent certification of upstream Pillar 9 database completeness. The supplied listing records were validated for the fields and cohorts used here. Where comparable listing-derived totals differ from published CREB totals, CREB remains authoritative.