
Calgary's Detached market remained balanced in August 2026, but the relationship between sales and available supply shifted toward more buyer choice. This report traces the 13-month activity trend, examines where sales and listing counts are diverging by price range, and compares official district supply and benchmark-price movement to show why the city-wide result does not describe every Detached segment equally.
Executive Summary
Calgary's Detached market remained balanced in August 2026, but the underlying relationship between activity and supply became more buyer-favouring than a year earlier. Official CREB statistics recorded 875 Sales, down 11.79% from August 2025, while Inventory declined only 2.69% to 2,969. With sales weakening faster than available supply, Months of Supply increased from 3.08 to 3.39. The Benchmark Price was $744,300, down 1.09% year over year.
The 13-month trajectory shows a strong recovery from the winter low into spring and early summer, followed by a July-August slowdown in sales. Inventory, by contrast, remained close to its early-summer level. Price-range evidence shows that the slowdown was concentrated rather than uniform. Sales increased Under $500,000 and at $1,000,000+, while every range from $500,000 through $999,999 declined. The largest drops occurred in the $600,000-$699,999 and $700,000-$799,999 ranges, where current Active Listings were also substantial.
Geographic conditions were similarly dispersed. West had the lowest district Months of Supply at 2.34 and a positive annual benchmark-price change, while North East had the highest supply reading at 5.36 and the largest benchmark decline at 6.44%. City Centre showed why the relationship is not mechanical, remaining positive year over year despite 3.84 Months of Supply. For buyers and sellers, the August evidence supports using the city-wide balanced classification as context, then narrowing expectations to the relevant price range, district and immediate comparable set.
Detached Market at a Glance
Source: CREB® City of Calgary Monthly Statistics, August 2026. Market Status is derived only from official Detached Months of Supply.
How the Detached Market Is Changing
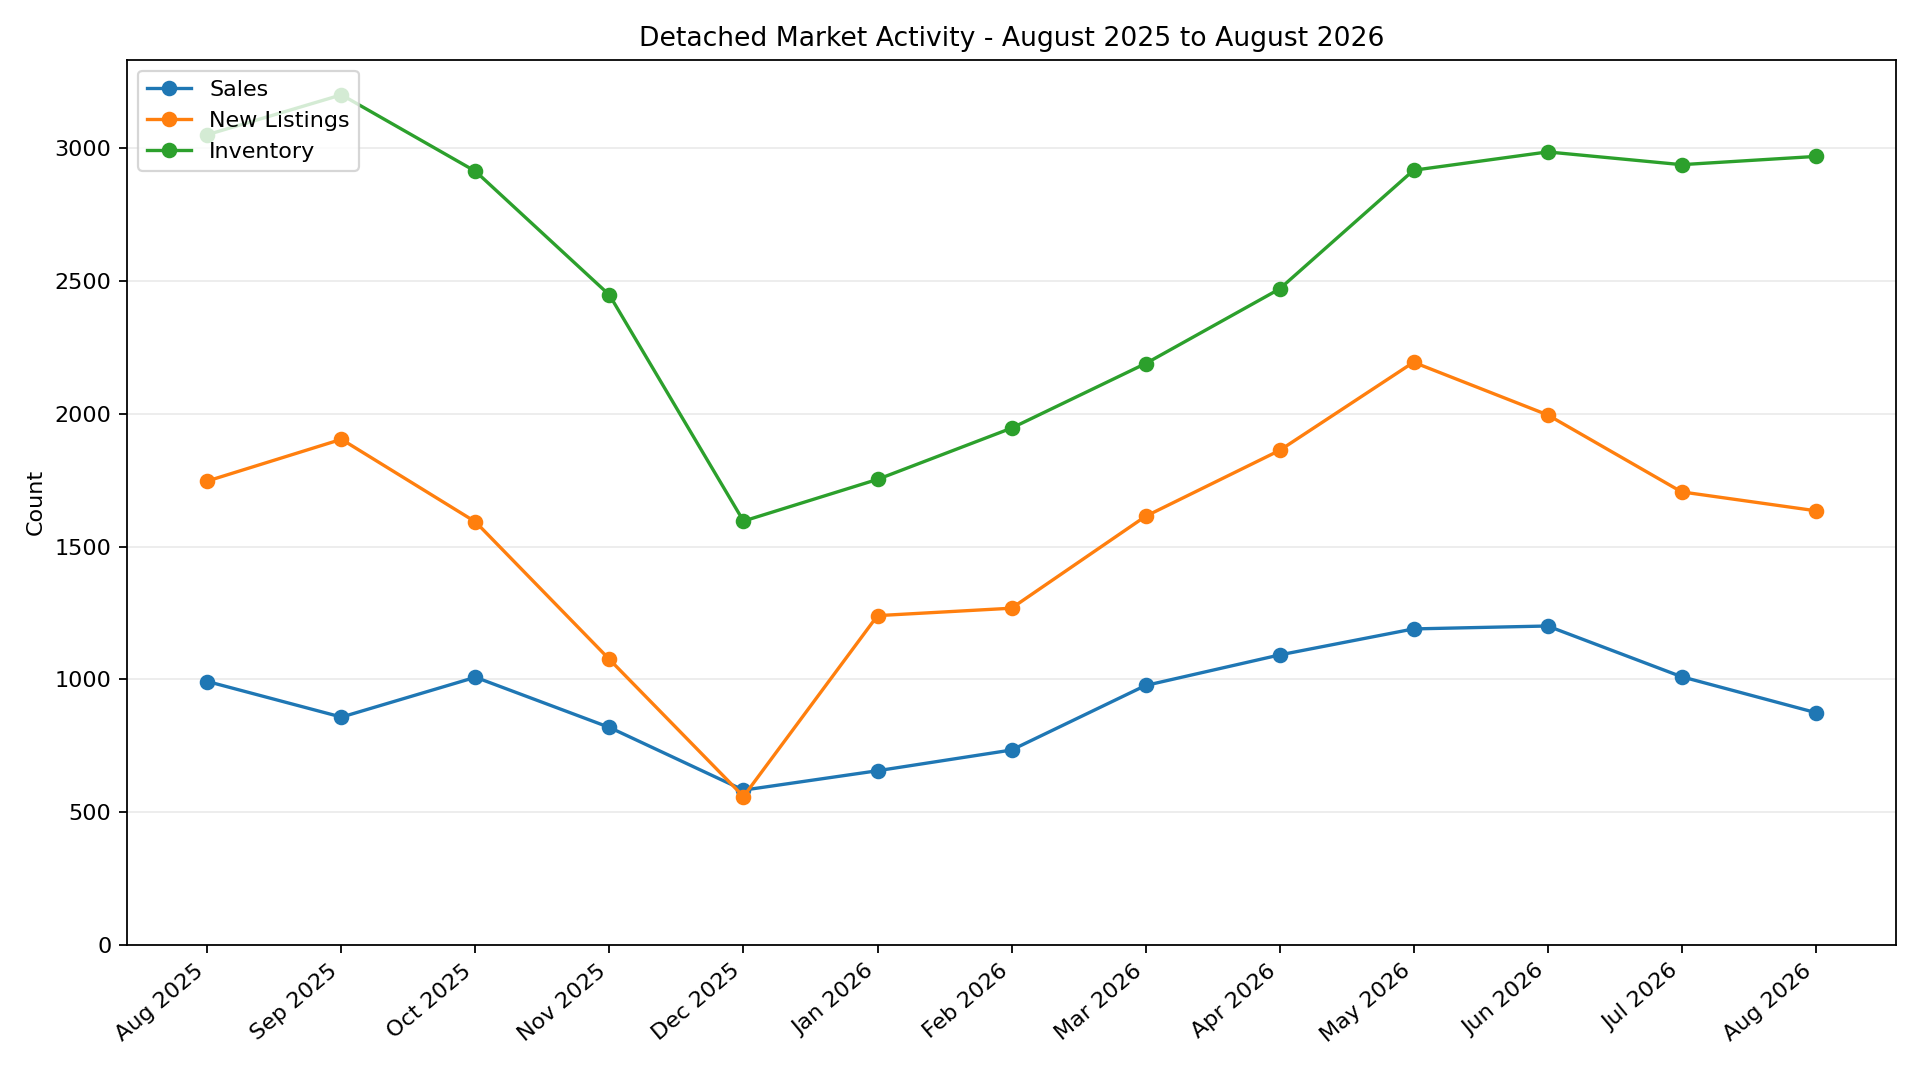
Calgary's Detached market entered August after a strong first-half recovery in activity and supply, followed by a clear summer slowdown in sales. Official CREB Sales rose from 656 in January to 1,201 in June, then fell to 1,010 in July and 875 in August. New Listings followed a similar broad pattern, reaching 2,194 in May before easing to 1,996 in June, 1,706 in July and 1,635 in August. Inventory moved differently: after climbing from 1,596 in December 2025 to 2,986 in June, it slipped to 2,938 in July and then edged back up to 2,969 in August.
The year-over-year comparison shows why that relationship matters. August Sales were 11.79% below August 2025, while New Listings were down 6.41% and Inventory was down only 2.69%. With sales falling more sharply than the available supply of homes, official Months of Supply increased from 3.08 a year earlier to 3.39. The market therefore remained within the governed Balanced Market range, but buyers had more supply relative to the month's sales pace than they did last August.
The 13-month sequence also separates a normal seasonal contraction from the more recent change in balance. Sales, New Listings and Inventory all declined into late 2025 and then rebuilt through spring 2026. By June, sales had reached the high point of the displayed 2026 series, while inventory was close to its September 2025 peak. The July-August period changed that relationship: sales retreated more noticeably than inventory. The Benchmark Price was $744,300 in August, 1.09% below a year earlier and essentially unchanged from July. That relative price stability contrasts with the sharper decline in monthly sales activity. Taken together, the evidence points to a balanced Detached market in which the pace of absorption softened during the summer even though inventory did not surge.
Where the Detached Market Is Diverging
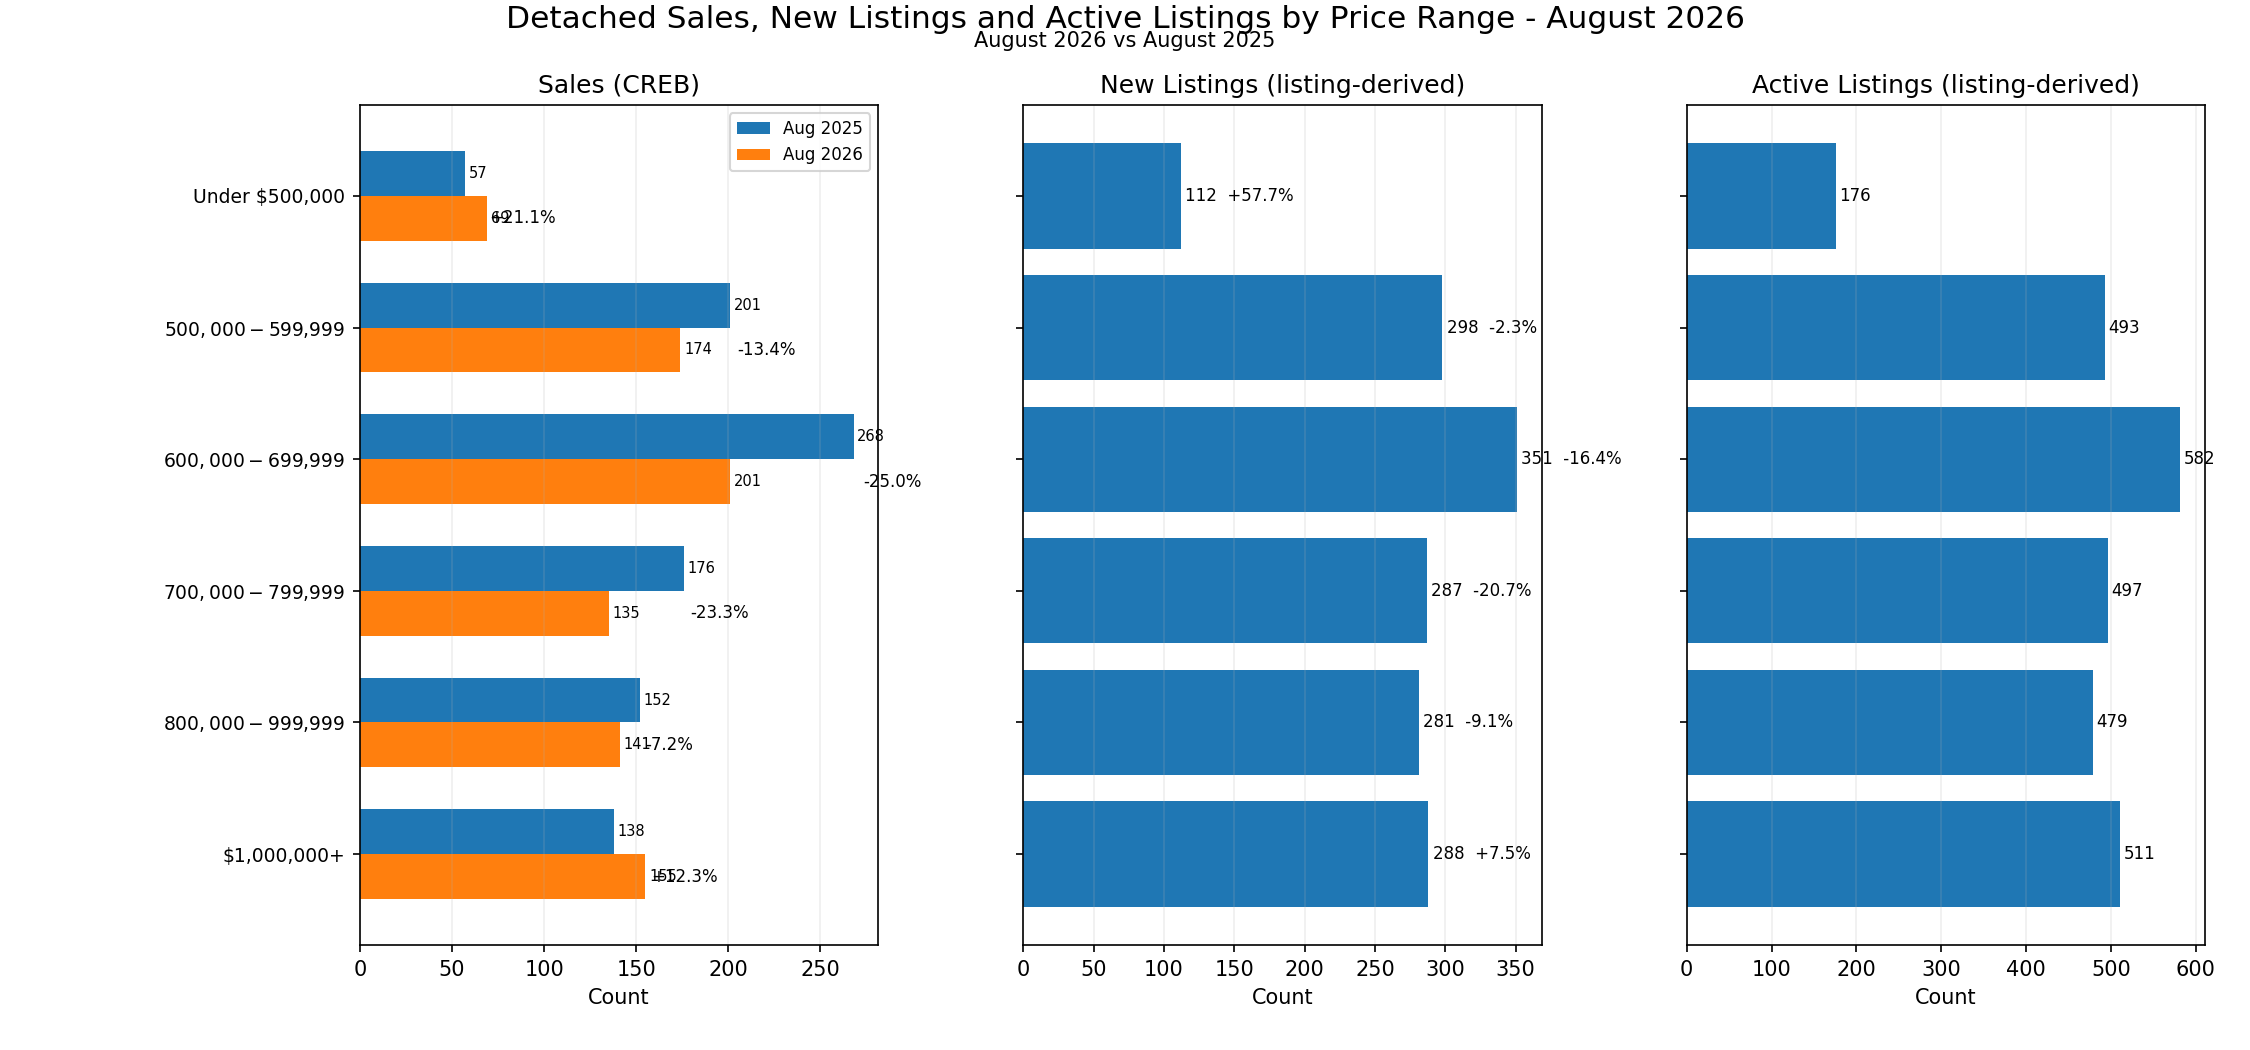
August's price-range evidence shows that the decline in Detached sales was concentrated in the middle of the market rather than spread evenly across all price levels. Official CREB Sales increased in two of the six governed ranges: Under $500,000 rose to 69 sales from 57 a year earlier, a 21.1% increase, while $1,000,000+ rose to 155 from 138, up 12.3%. Every range from $500,000 through $999,999 recorded fewer sales than in August 2025.
The largest sales declines occurred in the $600,000-$699,999 and $700,000-$799,999 ranges, down 25.0% and 23.3% respectively. Listing-derived New Listings moved in broadly the same direction in those two ranges, falling 16.4% and 20.7%. Current Active Listings were also substantial there: 582 in the $600,000-$699,999 range and 497 in the $700,000-$799,999 range. This combination shows weaker transaction activity alongside a meaningful pool of currently available listings without converting those counts into an ungoverned segmented market classification.
The two ranges with stronger sales had different supply profiles. Under $500,000 had only 176 current Active Listings, the lowest count among the six ranges, while listing-derived New Listings were up 57.7% year over year. At $1,000,000+, there were 511 Active Listings and New Listings were up 7.5%. Stronger sales at both ends of the price spectrum therefore do not imply the same level of current choice.
The $500,000-$599,999 and $800,000-$999,999 ranges were softer but less dramatically so. Sales declined 13.4% and 7.2%, while New Listings were down 2.3% and 9.1%. The broader pattern is a market in which sales momentum weakened most through the $600,000-$799,999 middle bands, while the lowest and highest governed ranges continued to record year-over-year sales growth. Current Active counts provide the supply context needed to interpret those differences.
| Price Range | Sales | Sales YoY | New Listings | New Listings YoY | Active Listings |
|---|---|---|---|---|---|
| Under $500,000 | 69 | +21.1% | 112 | +57.7% | 176 |
| $500,000-$599,999 | 174 | -13.4% | 298 | -2.3% | 493 |
| $600,000-$699,999 | 201 | -25.0% | 351 | -16.4% | 582 |
| $700,000-$799,999 | 135 | -23.3% | 287 | -20.7% | 497 |
| $800,000-$999,999 | 141 | -7.2% | 281 | -9.1% | 479 |
| $1,000,000+ | 155 | +12.3% | 288 | +7.5% | 511 |
Sales and Sales YoY are official CREB® measures aggregated from published Detached sales price buckets. New Listings, New Listings YoY and Active Listings are derived from supplied Pillar 9™ MLS® records. Active Listings is an Active-only listing count and is not CREB Inventory.
Geographic Differences
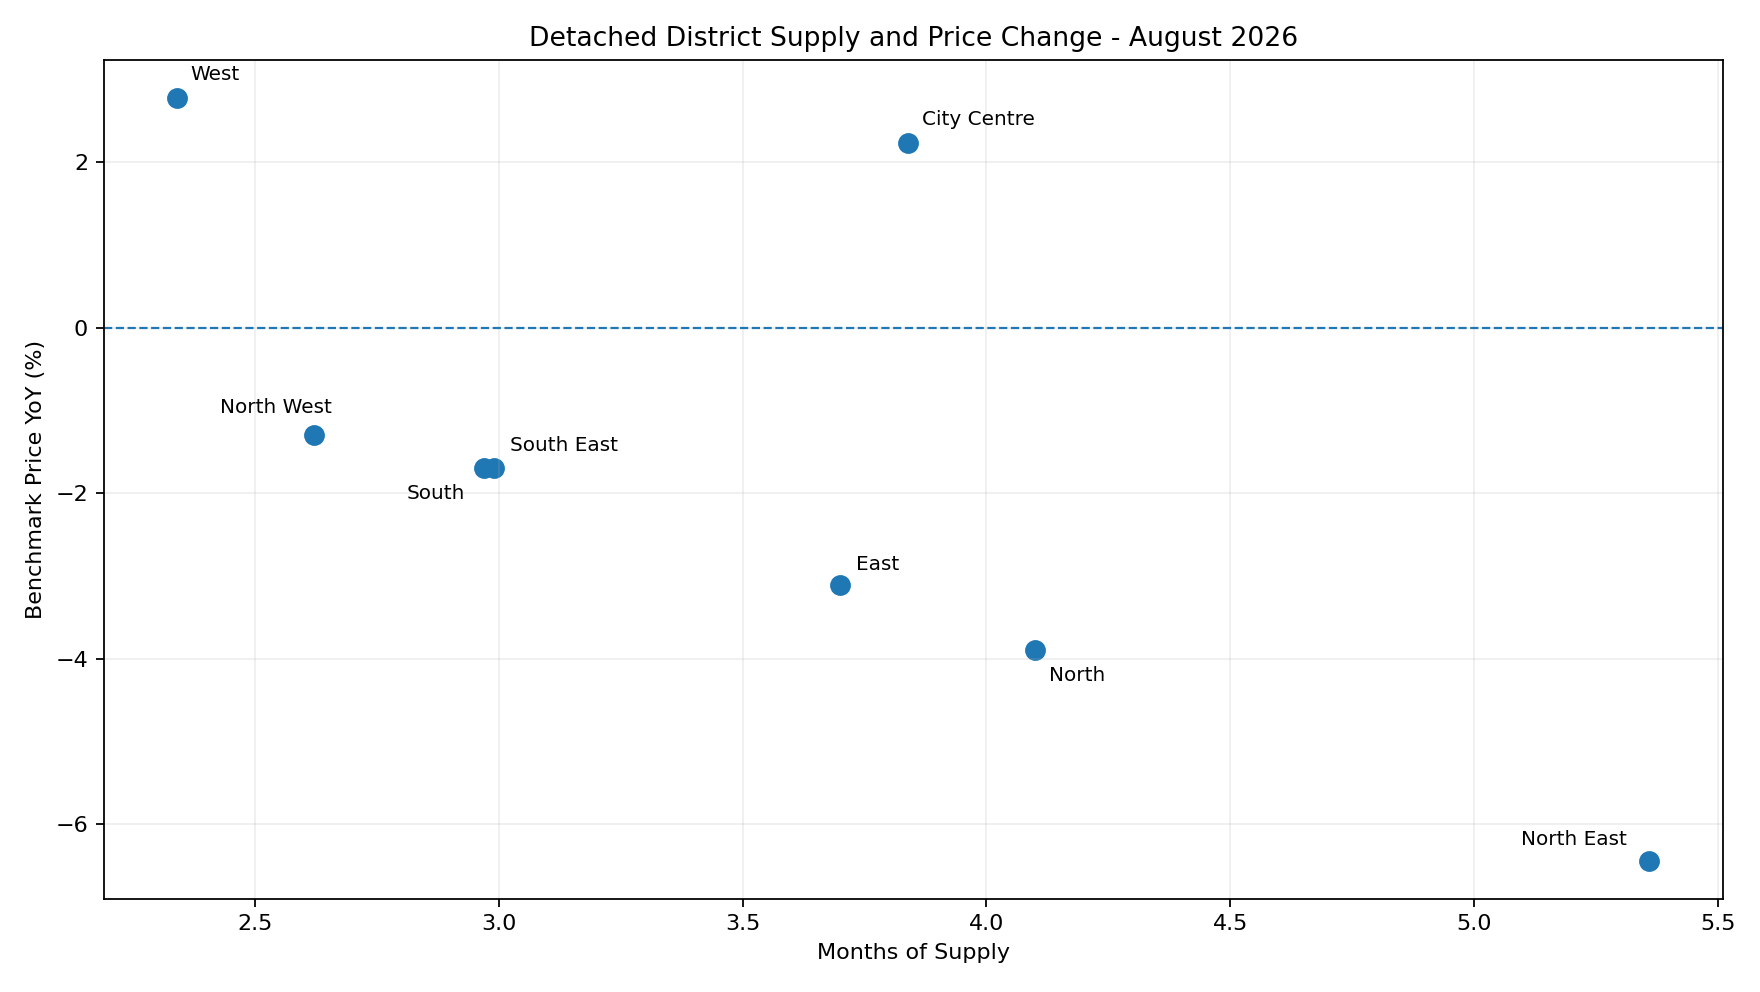
Detached conditions also varied materially across Calgary's eight CREB districts in August. Months of Supply ranged from 2.34 in West to 5.36 in North East. North West, South and South East were below 3.00, while City Centre was 3.84, North 4.10 and East 3.70. The spread shows that the city-wide 3.39 reading is an aggregate rather than a uniform description of local supply conditions.
Benchmark-price movement was similarly uneven. West recorded the strongest year-over-year increase at +2.78%, and City Centre was also positive at +2.24%. The other six districts were below their August 2025 benchmark levels. North East had the largest decline at -6.44%, followed by North at -3.89% and East at -3.11%.
Some district relationships are intuitive but not universal. North East combined the highest Months of Supply with the largest annual benchmark decline, while West combined the lowest supply reading with positive price movement. City Centre, however, remained positive year over year despite 3.84 Months of Supply, and North West had comparatively low supply with a negative annual benchmark change. The evidence therefore supports district-specific comparison, not a rule that a particular supply reading mechanically determines price movement.
| District | Sales | Inventory | Months of Supply | Benchmark Price | Benchmark Price YoY |
|---|---|---|---|---|---|
| City Centre | 98 | 376 | 3.84 | $995,700 | +2.24% |
| North East | 95 | 509 | 5.36 | $560,500 | -6.44% |
| North | 112 | 459 | 4.10 | $647,400 | -3.89% |
| North West | 130 | 341 | 2.62 | $781,500 | -1.30% |
| West | 93 | 218 | 2.34 | $992,500 | +2.78% |
| South | 178 | 529 | 2.97 | $715,200 | -1.69% |
| South East | 135 | 404 | 2.99 | $703,600 | -1.70% |
| East | 33 | 122 | 3.70 | $489,500 | -3.11% |
Source: CREB® City of Calgary Monthly Statistics, August 2026.
What Is Driving the Detached Market
The main internal mechanism in August was a change in the relationship between sales activity and available supply. Detached Sales were 11.79% lower than a year earlier, while Inventory declined only 2.69%. Because fewer sales were absorbing a supply base that remained relatively close to last year's level, Months of Supply increased to 3.39 even without an inventory surge. That shift explains why the overall market remained balanced but offered more supply relative to the current sales pace.
Price-range evidence shows that the weaker absorption was not uniform. Sales continued to grow below $500,000 and at $1,000,000+, while the $600,000-$799,999 ranges recorded the deepest declines. Current Active counts were substantial through those middle ranges, so the city-wide slowdown reflects a mix of segment-specific activity and available choice rather than one common response across all Detached homes.
Geography reinforces the same point. West remained relatively tight with positive annual benchmark movement, while North East had substantially more supply relative to sales and a deeper annual price decline. Other districts fell between those examples or combined supply and price measures differently. The observed market balance is therefore best explained by the interaction of sales pace and available supply within price ranges and districts, not by a single external cause supported by this report.
What This Means for Buyers and Sellers
For Detached buyers, August's city-wide Balanced Market classification indicates a broader negotiating environment than a simple seller-dominated market, but the amount of choice still depends heavily on price range and location. The increase in city-wide Months of Supply to 3.39 reflects sales slowing more than inventory. That can give buyers more time and more alternatives in some segments, but it should not be interpreted as the same level of leverage everywhere.
The price-range table illustrates the distinction. Under $500,000, sales increased year over year and the current Active Listings count was the lowest of the six governed ranges. Buyers in that range may therefore face a different competitive set from those searching in the $600,000-$799,999 ranges, where sales declined more than 20% and current Active counts were considerably higher. At $1,000,000+, both sales and New Listings increased while the Active count remained substantial, so activity and available choice are both relevant when assessing comparables.
Location changes the context again. West had 2.34 Months of Supply and a positive annual benchmark-price comparison, while North East had 5.36 Months of Supply and a larger annual decline. City Centre provides an important counterexample: its supply reading was higher than the city-wide figure, yet its benchmark remained above a year earlier. Buyers should therefore use the city-wide statistics as context and then narrow the evidence to the relevant district, price range and comparable properties.
For sellers, the same segmentation means that a Balanced Market does not remove pricing sensitivity. A property competing in a range or district with more available alternatives faces a different environment from one where current supply is tighter. Recent comparable sales, current competing listings and the property's exact segment remain more useful for positioning than assuming the city-wide 3.39 Months of Supply applies uniformly to every Detached listing.
What to Watch Next
First, watch the relationship between Detached Sales and Inventory. If sales stabilize or recover while inventory remains near current levels, Months of Supply could stop rising or tighten; if sales weaken further while inventory holds or grows, the market would move closer to the governed 4.0-month upper boundary of Balanced conditions.
Second, monitor the $600,000-$799,999 ranges. A recovery in sales relative to their August declines would narrow the current price-range divergence, while continued weakness alongside substantial Active counts would reinforce it.
Finally, compare district Months of Supply with Benchmark Price YoY. A narrowing of the gap between North East and the lower-supply western and southern districts would make the city-wide result more representative. A wider gap would make district-specific evidence even more important.
Explore the Market in More Detail
Sources and Methodology
Official CREB® City of Calgary Monthly Statistics are used for the Detached benchmark price, sales, new listings, inventory, months of supply, the 13-month activity series, Detached sales by price range, and the district measures shown in this report.
Pillar 9™ MLS® System records supplied for this report are used only for New Listings and New Listings YoY by price range, current Active Listings by price range, and internal source reconciliation. Price-range New Listings are grouped by Listing Contract Date and Original List Price. Active Listings use Current Price and include Active status only; Pending listings are excluded. These Active Listings counts are not the official CREB Inventory measure.
The overall Detached Market Status is based on official city-wide Detached Months of Supply: below 2.5 is a Seller's Market, 2.5 through 4.0 is a Balanced Market, and above 4.0 is a Buyer's Market. Price-range and district evidence is presented descriptively and is not assigned separate market-state classifications.