
Calgary's detached market entered October 2026 with slower sales, modestly lower inventory and more months of supply than a year earlier. This report examines the city's detached market using official CREB statistics, then compares activity across price ranges and districts. It separates published market measures from listing-level price-range counts and considers what the resulting differences mean for buyers and sellers.
Executive Summary
Calgary's detached market remained balanced in October 2026, but the balance reflected slower sales rather than a large increase in inventory. Official CREB recorded 847 detached sales, down 16.0% from a year earlier. New listings fell 5.5% to 1,505 and inventory eased 2.8% to 2,832. With transactions contracting more sharply than available supply, months of supply rose from 2.89 last October to 3.34. The detached benchmark price was $735,100, 0.7% below October 2025.
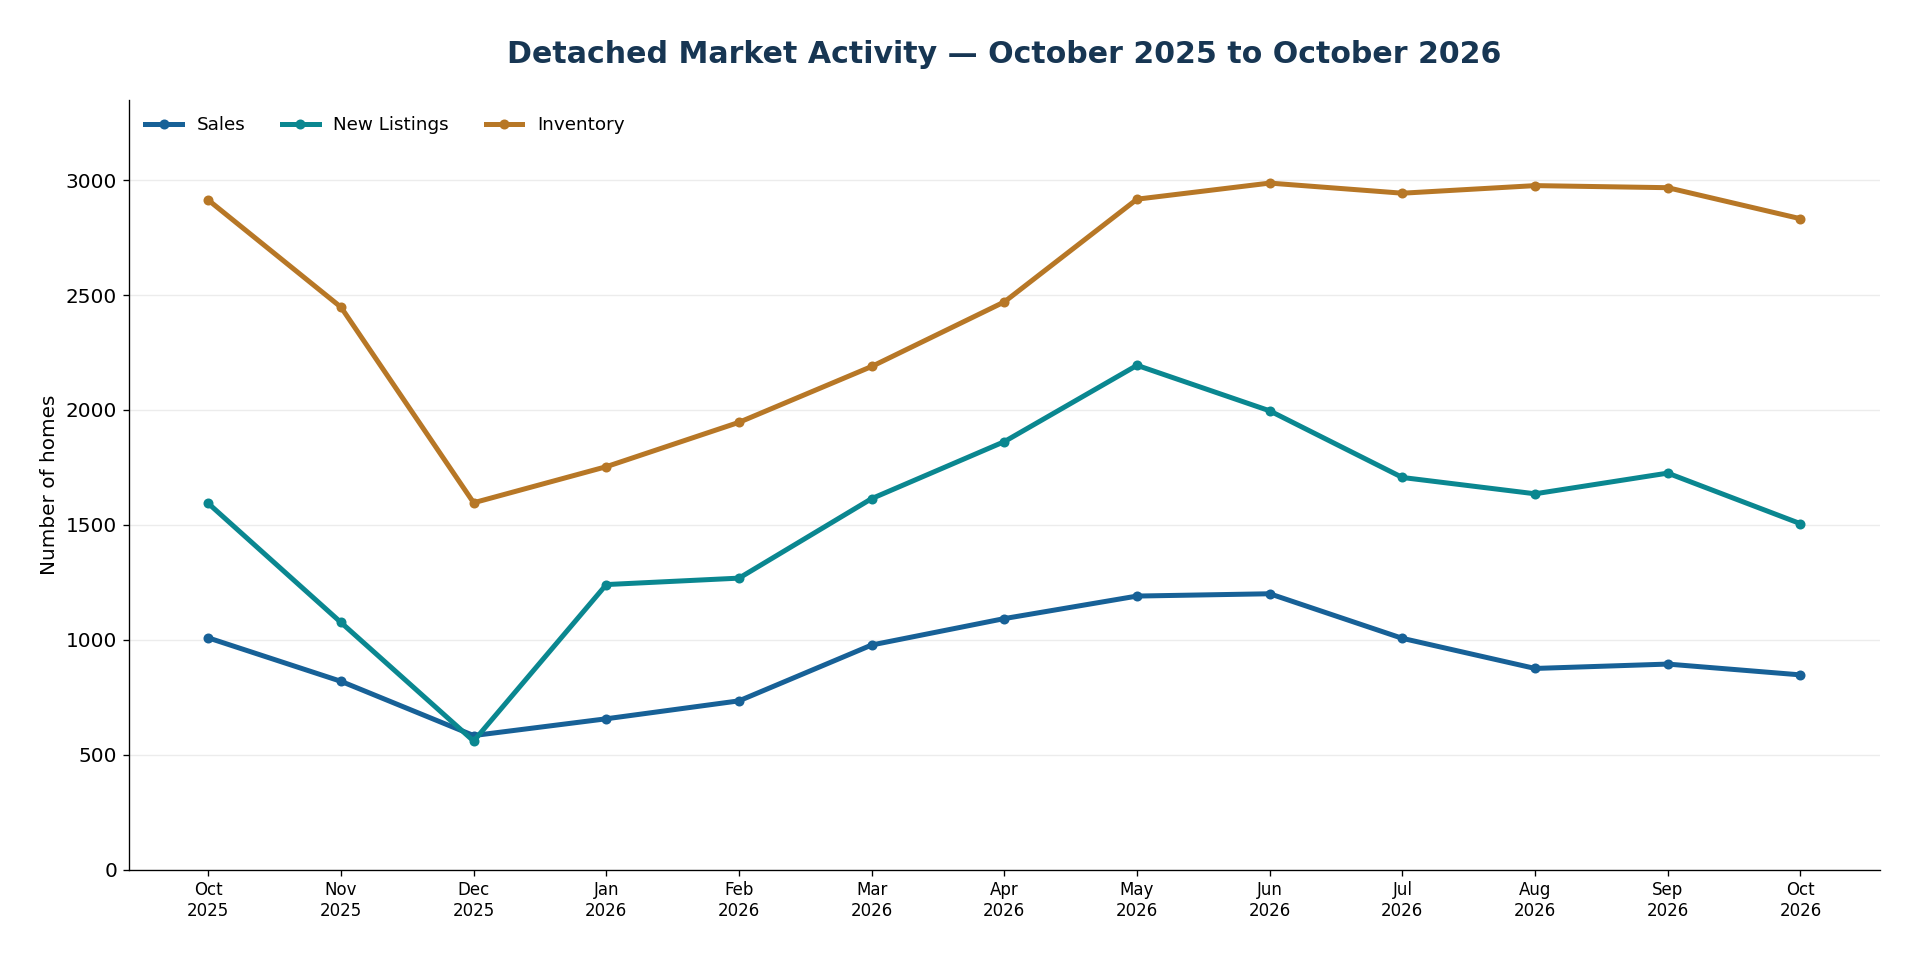
The 13-month sequence shows the transition from late-2025 lows to a spring 2026 increase in activity and a subsequent moderation through October. Inventory remained near 2,800 even as sales declined from their June high. The result is more selection relative to the current rate of completed purchases, although month-to-month changes alone do not establish how long that condition will last.
Price ranges told different stories. Official sales under $500,000 increased slightly, while the $700,000-$799,999 band recorded a 40.6% year-over-year decline. Listing-derived new listings fell by a smaller 14.4% in that same band. At $800,000-$999,999, new listings increased 9.1% even as sales decreased. These comparisons describe market activity and available choice without creating unsupported price-band market classifications.
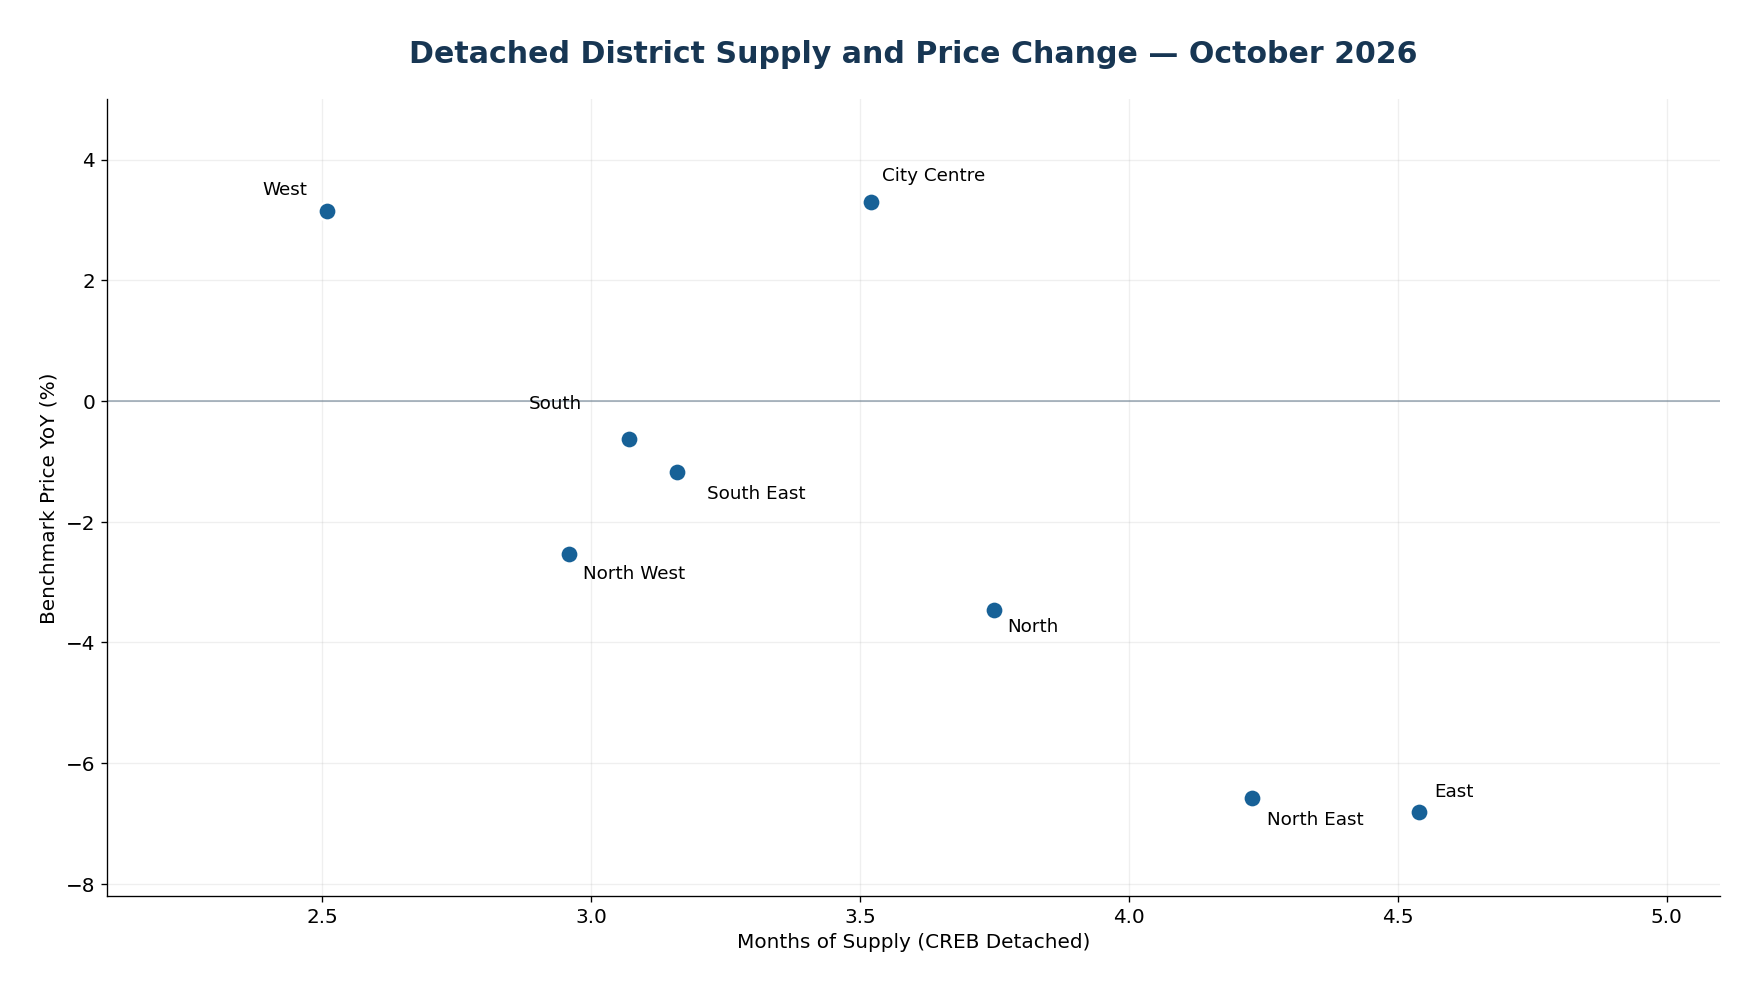
District performance also varied. West had 2.51 months of supply and a 3.15% annual benchmark-price increase; East had 4.54 months and a 6.81% decrease. City Centre posted a 3.29% benchmark gain while North East declined 6.58%. For buyers and sellers, the practical implication is to use local comparable sales and direct competition alongside city-wide totals. October's central finding is not a uniform decline, but a slower and increasingly differentiated detached market.
Detached Market at a Glance
How the Detached Market Is Changing
October's 847 detached sales were 16.0% below the 1,008 sales recorded a year earlier. New listings declined by a smaller 5.5%, to 1,505, while month-end inventory eased 2.8% to 2,832. The difference between the pace of sales and the change in available inventory is important: even with slightly fewer homes on the market than last October, available supply represented 3.34 months of current sales compared with 2.89 months a year ago. That places the detached segment in the Balanced Market range under the report's city-wide classification framework.
The 13-month trajectory shows that October did not arrive in isolation. Detached sales fell from 1,008 last October to 583 in December 2025, rose through the spring and reached 1,200 in June 2026. Transactions then moderated to 1,006 in July, 875 in August, 894 in September and 847 in October. This sequence describes the movement in completed activity without treating the latest decline as evidence that the same path must continue.
New-listing flow followed its own seasonal progression. After dropping to 559 in December, new detached listings climbed to 2,194 in May, then settled back to 1,505 by October. Inventory nevertheless remained relatively substantial: it rose from 1,596 in December to 2,987 in June, remained above 2,900 during July through September and closed October at 2,832. That combination of lower recent inflow and still-elevated selection helps explain why a single monthly new-listing figure does not describe the full competitive setting.
The October detached benchmark price was $735,100, down 0.7% from $740,400 a year earlier and below June's $750,500. The change is modest in the city-wide benchmark relative to the contraction in October transaction volume. The benchmark measures a standardized home, not the average price of the properties that happened to sell, so it is the more suitable published reference for this year-over-year pricing comparison. Together, the sales, supply and price series describe a market in which buyers generally have more time to compare alternatives than the faster-selling periods earlier in the cycle, but without a uniform pricing outcome across Calgary.
Where the Detached Market Is Diverging
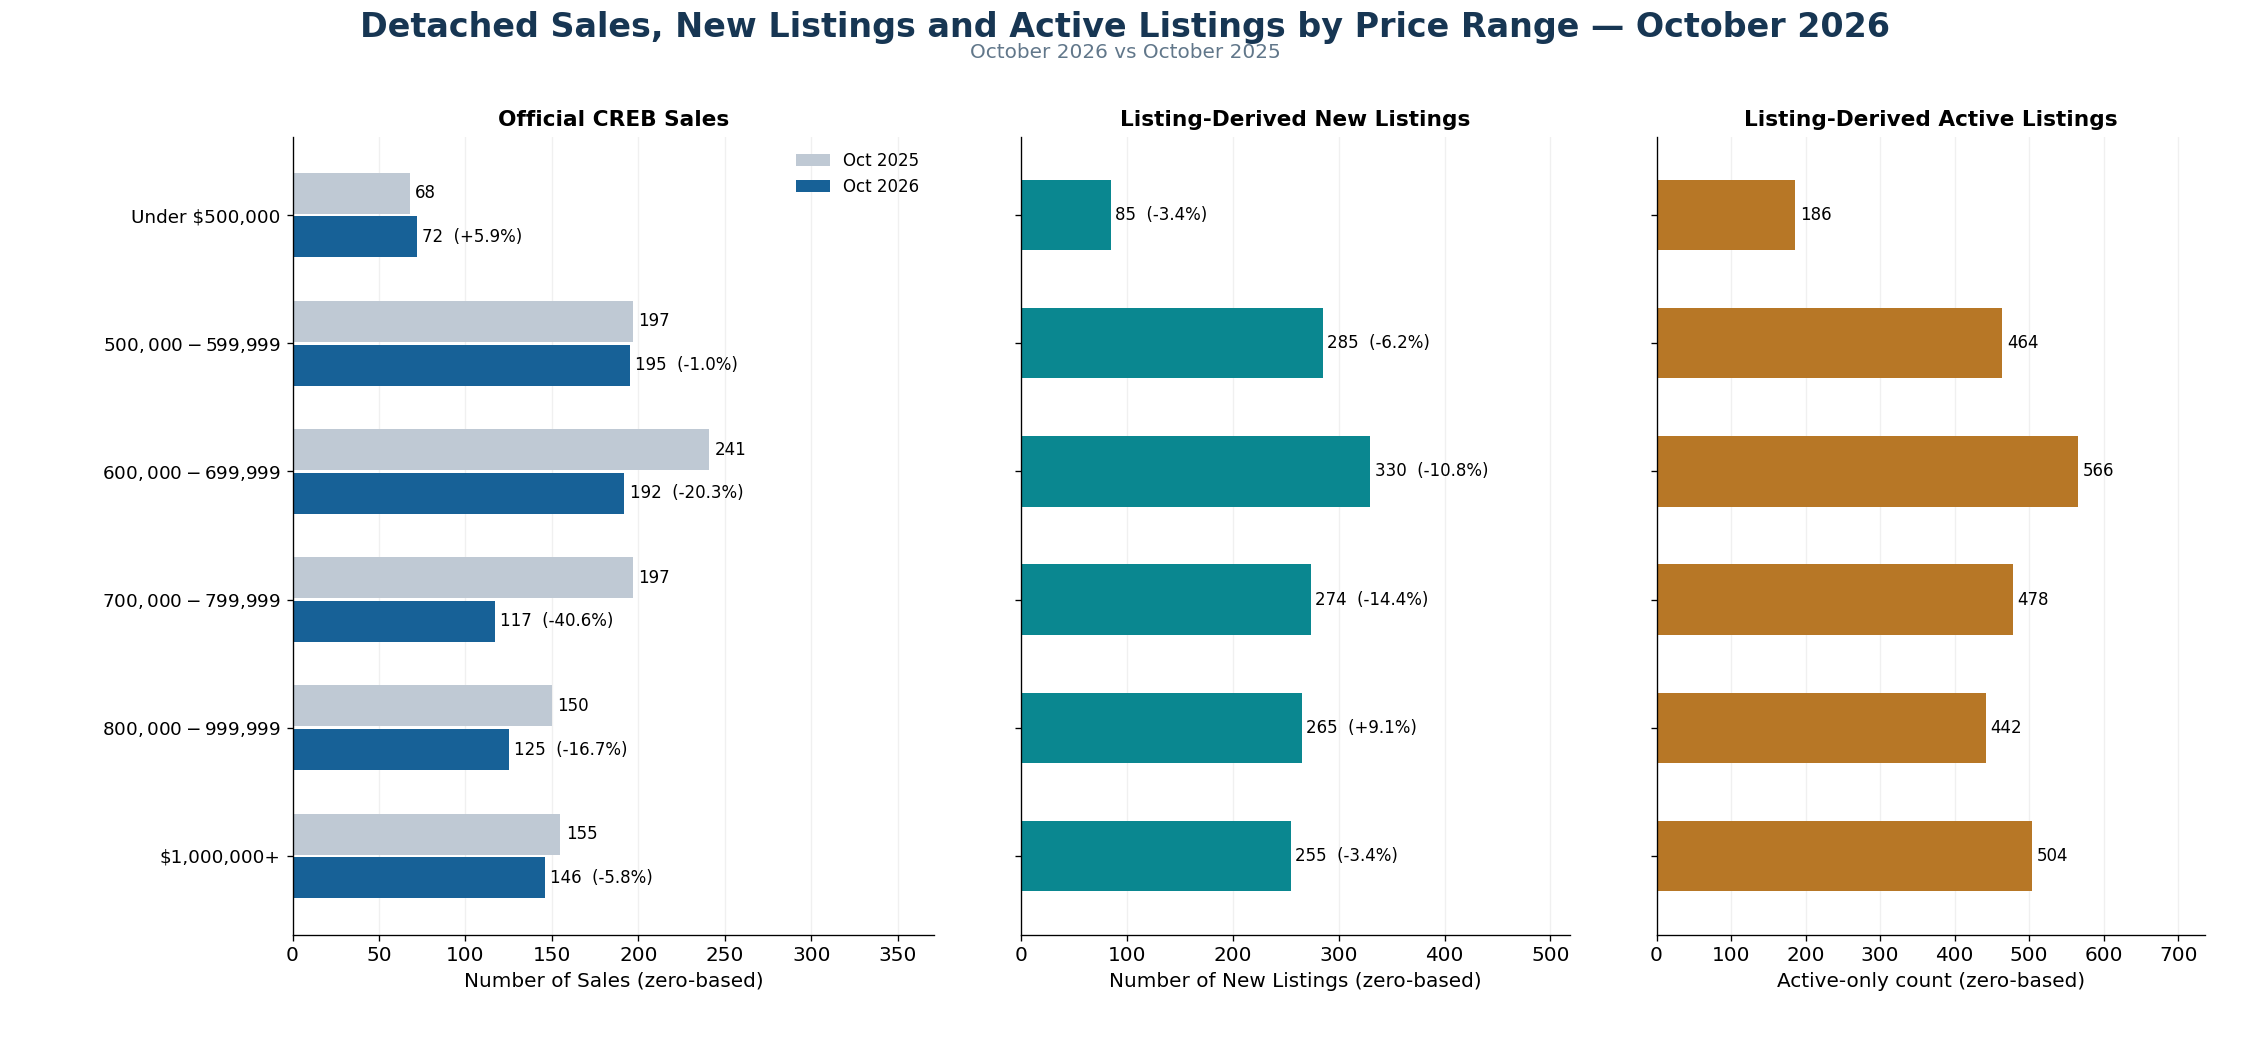
The price-range evidence shows that the October slowdown was not evenly distributed. Official CREB sales under $500,000 increased to 72 from 68 a year earlier, a 5.9% gain, while sales from $500,000 to $599,999 were nearly unchanged at 195 compared with 197. Above those entry bands, the most pronounced contraction was between $700,000 and $799,999: 117 sales versus 197 last October, a 40.6% decline. The $600,000-$699,999 band also fell materially, from 241 to 192 sales, or 20.3%.
At higher price points, sales were lower without following the same pattern. October sales in the $800,000-$999,999 range decreased from 150 to 125, and sales at $1 million or more moved from 155 to 146. These observations describe completed transactions by sale price; they should not be interpreted as a precise measure of demand for every type or quality of detached property within those broad bands.
Listing-level new listings offer a separate view of the available flow. The $700,000-$799,999 range had 274 newly listed detached homes in October, 14.4% fewer than the prior-year cohort, while its official sales fell 40.6%. Between $600,000 and $699,999, newly listed homes declined 10.8% and sales declined 20.3%. Conversely, the $800,000-$999,999 band recorded 265 new listings, up 9.1% from 243 a year earlier, despite fewer completed sales. The contrast is meaningful, but counts of new listings are not a substitute for all sources of buyer interest.
Active-only records also show substantial choice at several price points at the supplied snapshot: 566 between $600,000 and $699,999, 478 between $700,000 and $799,999, and 504 at $1 million or more. The table's Active Listings measure deliberately excludes Pending records and is not the same series as CREB's official Inventory. These figures help compare contemporaneous asking-price selection with recent sales patterns, not calculate a market state or months of supply for individual price ranges.
| Price Range | Sales | Sales YoY | New Listings | New Listings YoY | Active Listings |
|---|---|---|---|---|---|
| Under $500,000 | 72 | +5.9% | 85 | -3.4% | 186 |
| $500,000-$599,999 | 195 | -1.0% | 285 | -6.2% | 464 |
| $600,000-$699,999 | 192 | -20.3% | 330 | -10.8% | 566 |
| $700,000-$799,999 | 117 | -40.6% | 274 | -14.4% | 478 |
| $800,000-$999,999 | 125 | -16.7% | 265 | +9.1% | 442 |
| $1,000,000+ | 146 | -5.8% | 255 | -3.4% | 504 |
Sales and Sales YoY: official CREB® City of Calgary Monthly Statistics. New Listings, New Listings YoY and Active Listings: Pillar 9™ MLS® records. Active Listings excludes Pending and is not equivalent to official CREB Inventory.
Geographic Differences
Detached conditions differed considerably across Calgary's eight districts in October. Official months of supply ranged from 2.51 in the West to 4.54 in the East. North West registered 2.96 months and South 3.07, while North East stood at 4.23 and North at 3.75. These are district comparisons of published supply relative to monthly sales; they are not separate market-status classifications.
Benchmark-price movements diverged just as sharply. City Centre's detached benchmark increased 3.29% year over year to $992,500, and West rose 3.15% to $988,400. North East and East reported declines of 6.58% and 6.81%, respectively. The geographic scatter makes the contrast visible, but one month's association between supply and price change does not establish that a particular level of supply caused a particular price result.
Sales volumes also differed in scale. South recorded 179 detached sales and 550 units of inventory, compared with East's 24 sales and 109 units of inventory. A market-wide benchmark therefore blends areas with very different housing stock, trading volume and current conditions. Buyers evaluating a specific neighbourhood and sellers positioning a particular home should place the city-wide numbers alongside the relevant district evidence rather than assuming one Calgary-wide trajectory applies everywhere.
| District | Sales | Inventory | Months of Supply | Benchmark Price | Benchmark Price YoY |
|---|---|---|---|---|---|
| City Centre | 104 | 366 | 3.52 | $992,500 | +3.29% |
| North East | 102 | 431 | 4.23 | $548,000 | -6.58% |
| North | 117 | 439 | 3.75 | $635,700 | -3.46% |
| North West | 112 | 331 | 2.96 | $765,500 | -2.53% |
| West | 86 | 216 | 2.51 | $988,400 | +3.15% |
| South | 179 | 550 | 3.07 | $705,700 | -0.63% |
| South East | 122 | 385 | 3.16 | $695,700 | -1.18% |
| East | 24 | 109 | 4.54 | $463,800 | -6.81% |
Source: CREB® City of Calgary Monthly Statistics, October 2026. CREB notes that city totals can include activity from areas not represented by an individual community or district.
What Is Driving the Detached Market
The central mechanism visible in October's detached figures is the relationship between turnover and available supply. Sales were down almost 16% from last October, while inventory was down less than 3%. A smaller monthly sales denominator therefore corresponded to more months of supply even though the absolute inventory count edged lower. That distinction matters when assessing whether a decline in listings automatically means conditions are tightening: the pace of completed purchases must be considered alongside the number of homes offered.
Price-range comparisons add another layer. Official sales fell especially sharply in the $700,000-$799,999 band, while new listing flow in that band decreased by a substantially smaller percentage. The $800,000-$999,999 band showed the opposite direction for new listings and sales: more new offerings but fewer transactions than in October 2025. These are signs of uneven absorption across price points, not proof of a single cause such as financing, migration or construction activity.
Geography further limits broad conclusions. West and City Centre registered positive annual detached benchmark changes, while East and North East were materially lower. Differences in local inventory and sales are observable, but the report does not have evidence to allocate each price movement to a particular external driver. The defensible interpretation is that Calgary's detached market has become more selective and location-sensitive, with the current mixture of listings and completed sales varying substantially by price and district.
What This Means for Buyers and Sellers
For detached-home buyers, October's 3.34 months of supply points to a more measured city-wide environment than last year's 2.89 months. That can create opportunities to compare properties, review recent comparable sales and assess conditions before committing. It does not mean every appealing home will face little competition: the West and North West districts had notably less supply relative to sales than East and North East, and individual neighbourhoods can differ again from their broader district.
Price-range evidence can help direct the search. The largest year-over-year sales decline occurred between $700,000 and $799,999, but a buyer should not assume a matching decline in every asking price. That band's active selections and newly listed counts describe available options, not how a specific seller will respond to an offer. In the sub-$600,000 bands, completed sales held up comparatively well. Buyers should therefore use the most local and recent sales evidence for negotiations rather than treating a headline decline as a universal discount.
For sellers, the first priority is positioning against the competition a buyer can actually tour. October's slower sales pace gives the list-price decision, condition and presentation added practical weight. A home priced to its direct comparables may be assessed very differently from one competing across a larger pool of similar choices. Review active competitors and recent successful transactions together, while recognizing that Active Listings here are a listing-level snapshot rather than CREB's broader official Inventory figure.
Sellers should also distinguish district price performance from city averages. Positive benchmark-price changes in West and City Centre do not guarantee a premium for every detached listing there, just as declines in East and North East do not prescribe a single adjustment for all properties. The useful approach is to identify the closest comparable properties by location, age, size and condition, then revisit pricing promptly if enquiry, showings and offers do not support the initial position.
What to Watch Next
The next monthly CREB release will clarify whether October's increase in detached months of supply persists or reverses as sales and new listings move into winter. Watch the relationship between completed sales and month-end inventory, not either figure alone. A continued decline in sales with inventory holding comparatively steady would extend the pattern of greater selection relative to turnover; stronger sales absorption would point in another direction.
The detached benchmark price deserves a separate check against its current $735,100 level and against the prior year's comparable month. One modest annual change does not establish a durable trend. Monitor whether the pronounced sales slowdown in the $700,000-$799,999 band continues, and whether the $800,000-$999,999 band's higher new-listing flow translates into transactions.
Finally, compare the eight CREB districts again rather than assuming convergence. West and City Centre's positive annual benchmark changes contrast with declines in East and North East. Whether those gaps narrow or widen will be useful evidence when updating neighbourhood-specific advice.
Explore the Market in More Detail
Sources and Methodology
Published benchmark prices, market-wide sales, new listings, inventory, months of supply, 13-month market activity, price-range sales and district statistics come from CREB® City of Calgary Monthly Statistics for October 2026. The detached market classification is based on the published city-wide detached months of supply.
Price-range New Listings, year-over-year New Listings changes and current Active Listings are calculated from supplied Pillar 9™ MLS® System records for detached properties. New Listings are grouped by original listing price; current Active Listings are grouped by current asking price and exclude Pending records. Active Listings in the price-range table are not the same measure as CREB's official Inventory. Price-range Sales use official CREB figures. All comparisons refer to October 2026 and October 2025 unless another period is specified.