
The Calgary Row Monthly Market Report examines October 2026 sales, new listings, inventory, benchmark prices and geographic differences for row and townhouse homes. Official CREB statistics establish the city-wide and district picture; supplied Pillar 9 listing records provide additional detail by price range. The report distinguishes stronger and weaker segments and explains what current supply conditions mean for buyers and sellers.
Executive Summary
Calgary's Row market entered October 2026 with more available supply relative to the pace of sales than a year earlier. Official CREB reported 241 Row sales, down 11.72% year over year, against inventory of 1,069, up 1.33%. Months of supply reached 4.44, placing the city-wide segment in Buyer's Market territory under the report's fixed classification framework. The benchmark price was $407,500, down 5.12% from October 2025. These readings describe a softer overall competitive balance, although neither the monthly sales total nor the city-wide price movement captures every part of the market.
The 13-month trajectory shows sales peaking in spring and then easing, while inventory remained above 1,000 from May onward. Price-range results reveal an important split. Sales below $400,000 improved modestly from last October, whereas sales from $400,000 through $799,999 declined. The supplied listing records show current active choices concentrated in the $300,000 to $499,999 price ranges, but those counts are not official CREB Inventory.
Geographic variation is equally material. North East and North recorded considerably higher months of supply than West, South East and City Centre. Every district reported a lower year-over-year benchmark price, with the steepest decline in East. This variability means city-wide conditions should frame, not replace, analysis of the property, price range and district under consideration.
For buyers, the evidence supports careful comparisons among current alternatives. For sellers, competitive positioning depends more on directly comparable active and sold homes than on broad averages alone. The next readings worth monitoring are sales relative to inventory, the divergence in sales by price range and the size of district supply gaps.
Row Market at a Glance
How the Row Market Is Changing
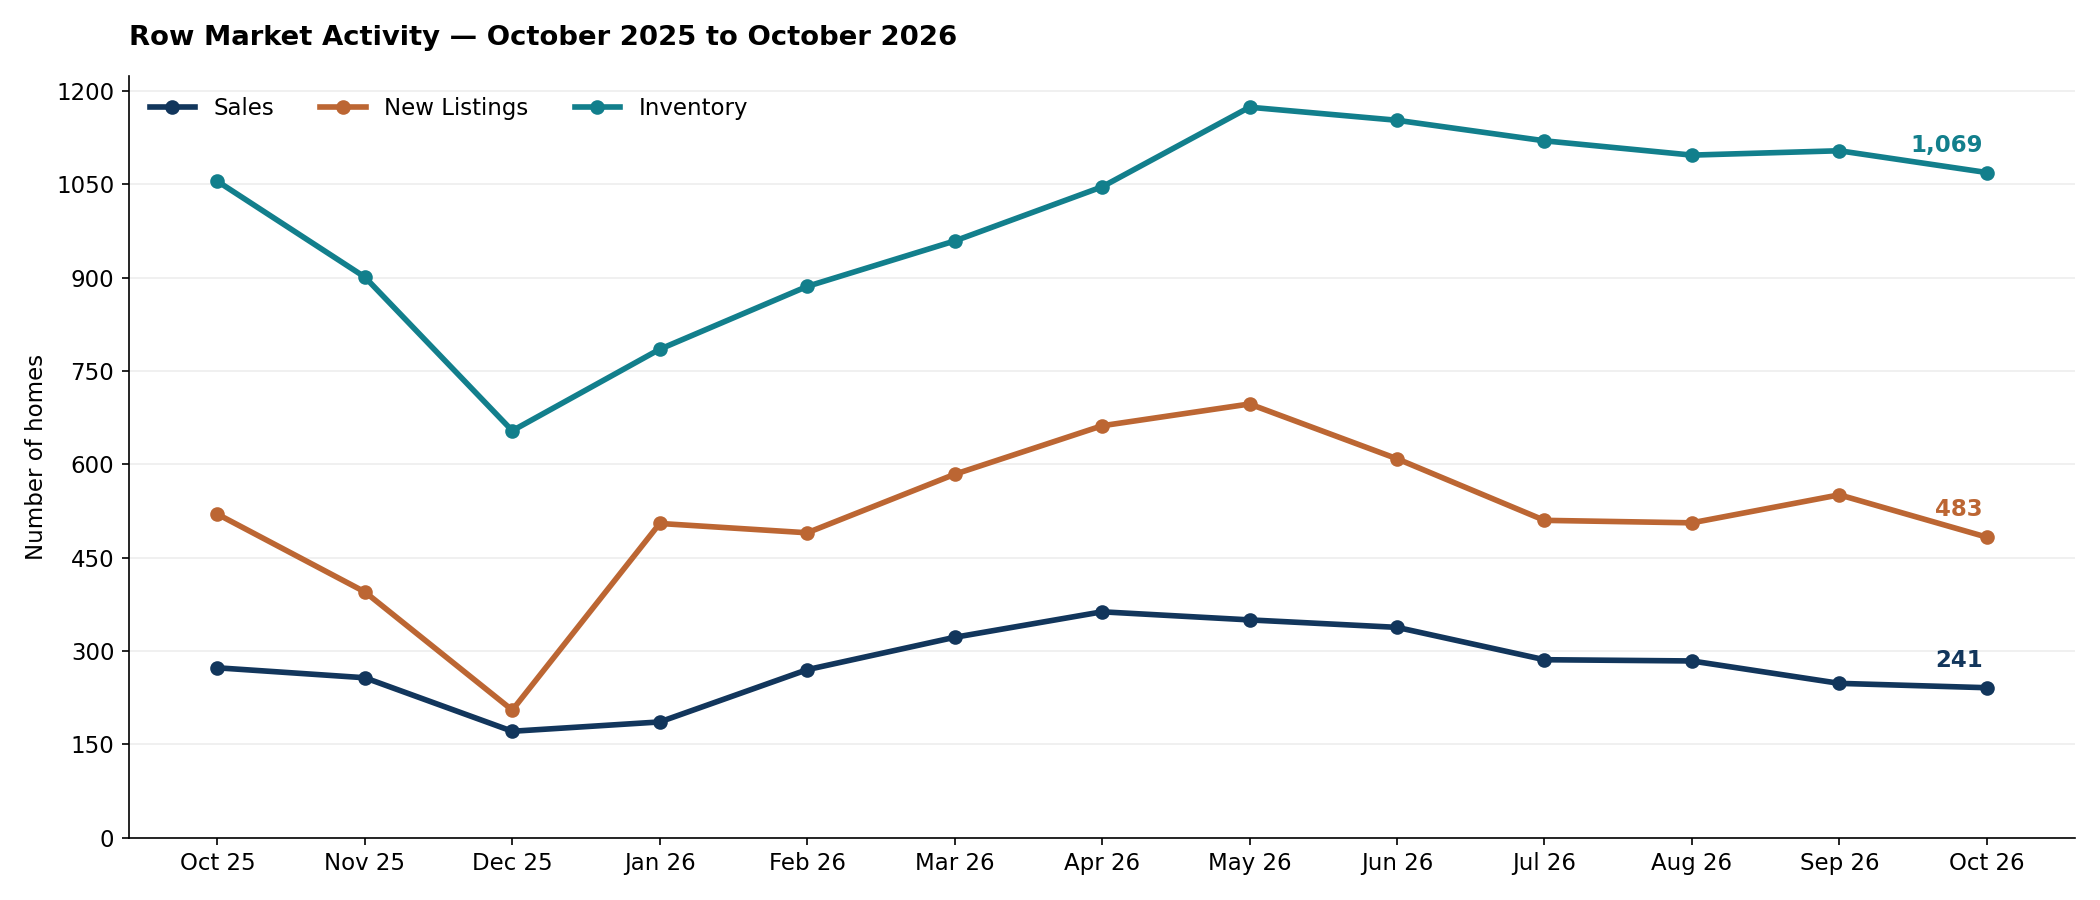
Calgary's row market entered October with sales activity lower than the same period a year earlier, while the amount of available inventory remained elevated relative to much of the preceding winter. Official CREB reported 241 October sales, compared with 273 in October 2025. The current reading also followed a gradual easing from the spring peak rather than an isolated one-month decline. Sales rose from 186 in January to 363 in April, then moderated to 350 in May, 338 in June, 286 in July, 284 in August and 248 in September before reaching 241 in October.
New listings followed a different seasonal path. They moved from 505 in January to 697 in May, then eased through summer. September briefly increased to 551 before October returned to 483. The October total was below the 520 new listings recorded one year earlier. New listings therefore declined year over year, but still exceeded sales during the reporting month. This is important because weaker listing inflow does not, by itself, imply a shortage when the existing stock of homes remains substantial.
Inventory provides that context. Row inventory began the 13-month comparison at 1,055 in October 2025, fell to 654 by December, and rebuilt during the first half of 2026. It reached 1,174 in May and remained above 1,000 throughout June to October. October's 1,069 listings were slightly above the 1,055 reported a year earlier despite the retreat from the spring peak. Inventory did not fall in step with sales over the full year.
The combined outcome is visible in months of supply, which reached 4.44 compared with 3.86 a year earlier. Under the report's fixed market-status framework, that puts the city-wide Row segment in Buyer's Market territory. The benchmark price was $407,500, down 5.12% year over year. The sequence describes a market in which buyers have more time and competing options than sales counts alone would suggest; it does not establish a permanent trend or explain it through outside economic causes.
Where the Row Market Is Diverging
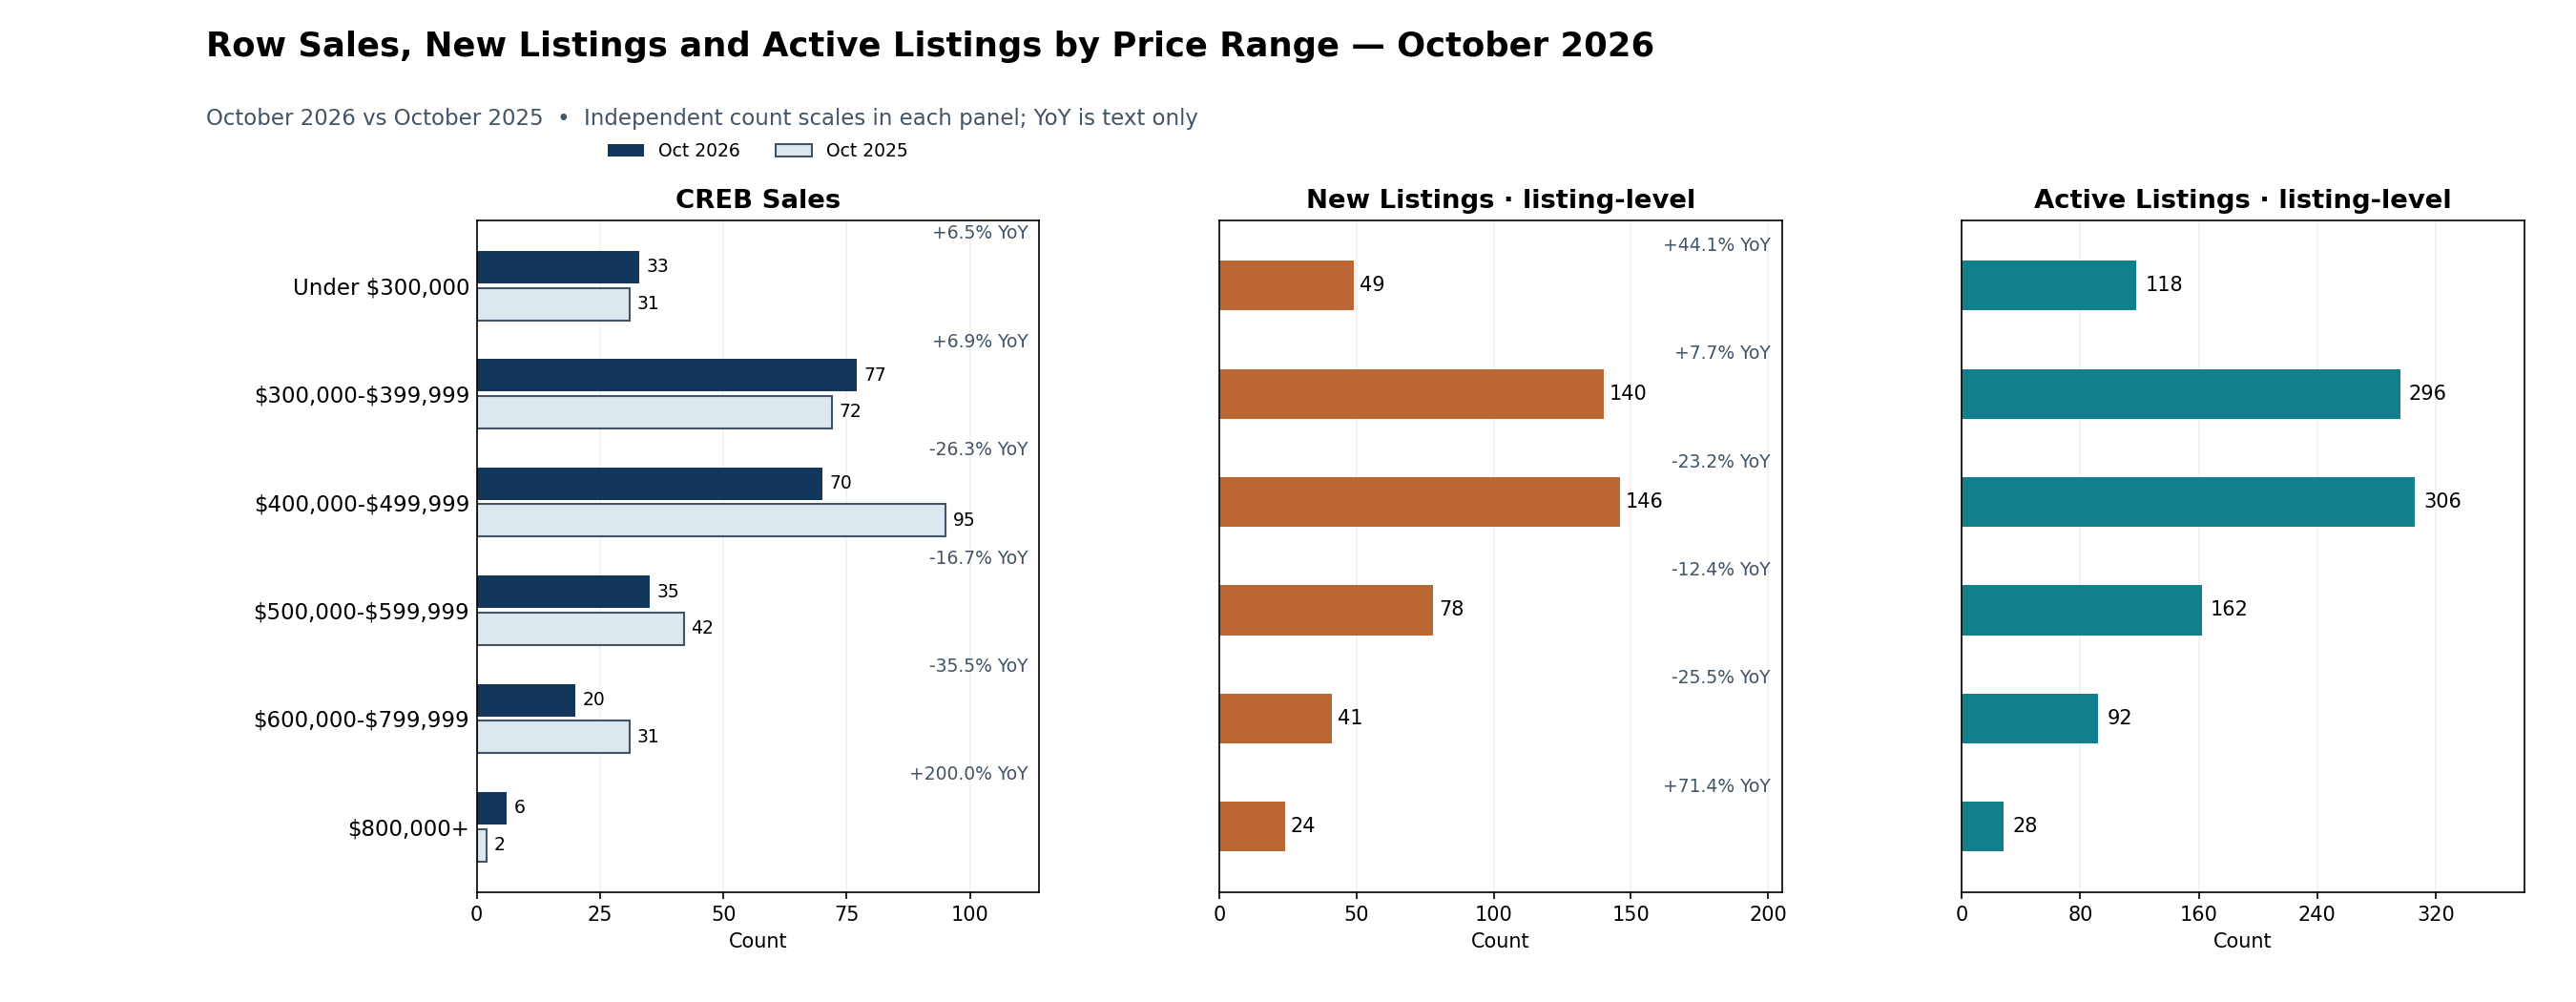
The city-wide decline in October Row sales was not uniform across prices. Official CREB sales under $300,000 increased to 33 from 31 a year earlier, while sales from $300,000 to $399,999 increased to 77 from 72. Those two lower-price ranges together showed modestly stronger transactions even as total Row sales declined. At the same time, the $400,000 to $499,999 range fell to 70 from 95 sales, a 26.3% decrease, and the $500,000 to $599,999 range declined to 35 from 42.
The reduction also extended into the $600,000 to $799,999 segment, where sales fell to 20 from 31. At $800,000 and above, sales rose from two to six, a large percentage gain based on very few transactions. That small higher-price sample should not be treated as evidence of broad-based strength. Together the ranges show why an overall sales figure can conceal distinct price-point conditions.
The listing-level dataset adds a separate view of new and active supply. New listings under $300,000 rose to 49 from 34 in October a year earlier, while the $300,000 to $399,999 range increased to 140 from 130. By comparison, new listings from $400,000 to $499,999 dropped to 146 from 190, and those from $600,000 to $799,999 decreased to 41 from 55. These are listing-contract counts grouped by original asking price, not CREB sales counts.
Current active-only inventory in the supplied listing records was most numerous in the $400,000 to $499,999 range, at 306, followed by 296 in the $300,000 to $399,999 range. These counts describe present options within the supplied snapshot and do not represent official CREB Inventory or establish historical active-listing growth. The relatively resilient lower-priced sales occurred alongside increased new listing flow; the weaker middle-to-upper sales occurred despite fewer newly listed homes in several ranges.
The practical distinction is between transaction activity and the supply being offered at each price. A price range with many active properties does not automatically have a uniform negotiating environment, because condition, location and competing property attributes still matter. The governed counts identify where further comparable-property analysis is most relevant without assigning market-status labels to individual price bands.
| Price Range | Sales | Sales YoY | New Listings | New Listings YoY | Active Listings |
|---|---|---|---|---|---|
| Under $300,000 | 33 | +6.5% | 49 | +44.1% | 118 |
| $300,000-$399,999 | 77 | +6.9% | 140 | +7.7% | 296 |
| $400,000-$499,999 | 70 | -26.3% | 146 | -23.2% | 306 |
| $500,000-$599,999 | 35 | -16.7% | 78 | -12.4% | 162 |
| $600,000-$799,999 | 20 | -35.5% | 41 | -25.5% | 92 |
| $800,000+ | 6 | +200.0% | 24 | +71.4% | 28 |
Sales and Sales YoY: official CREB. New Listings, New Listings YoY and Active Listings: supplied Pillar 9 MLS® records. Active Listings includes Active status only and is not CREB Inventory.
Geographic Differences
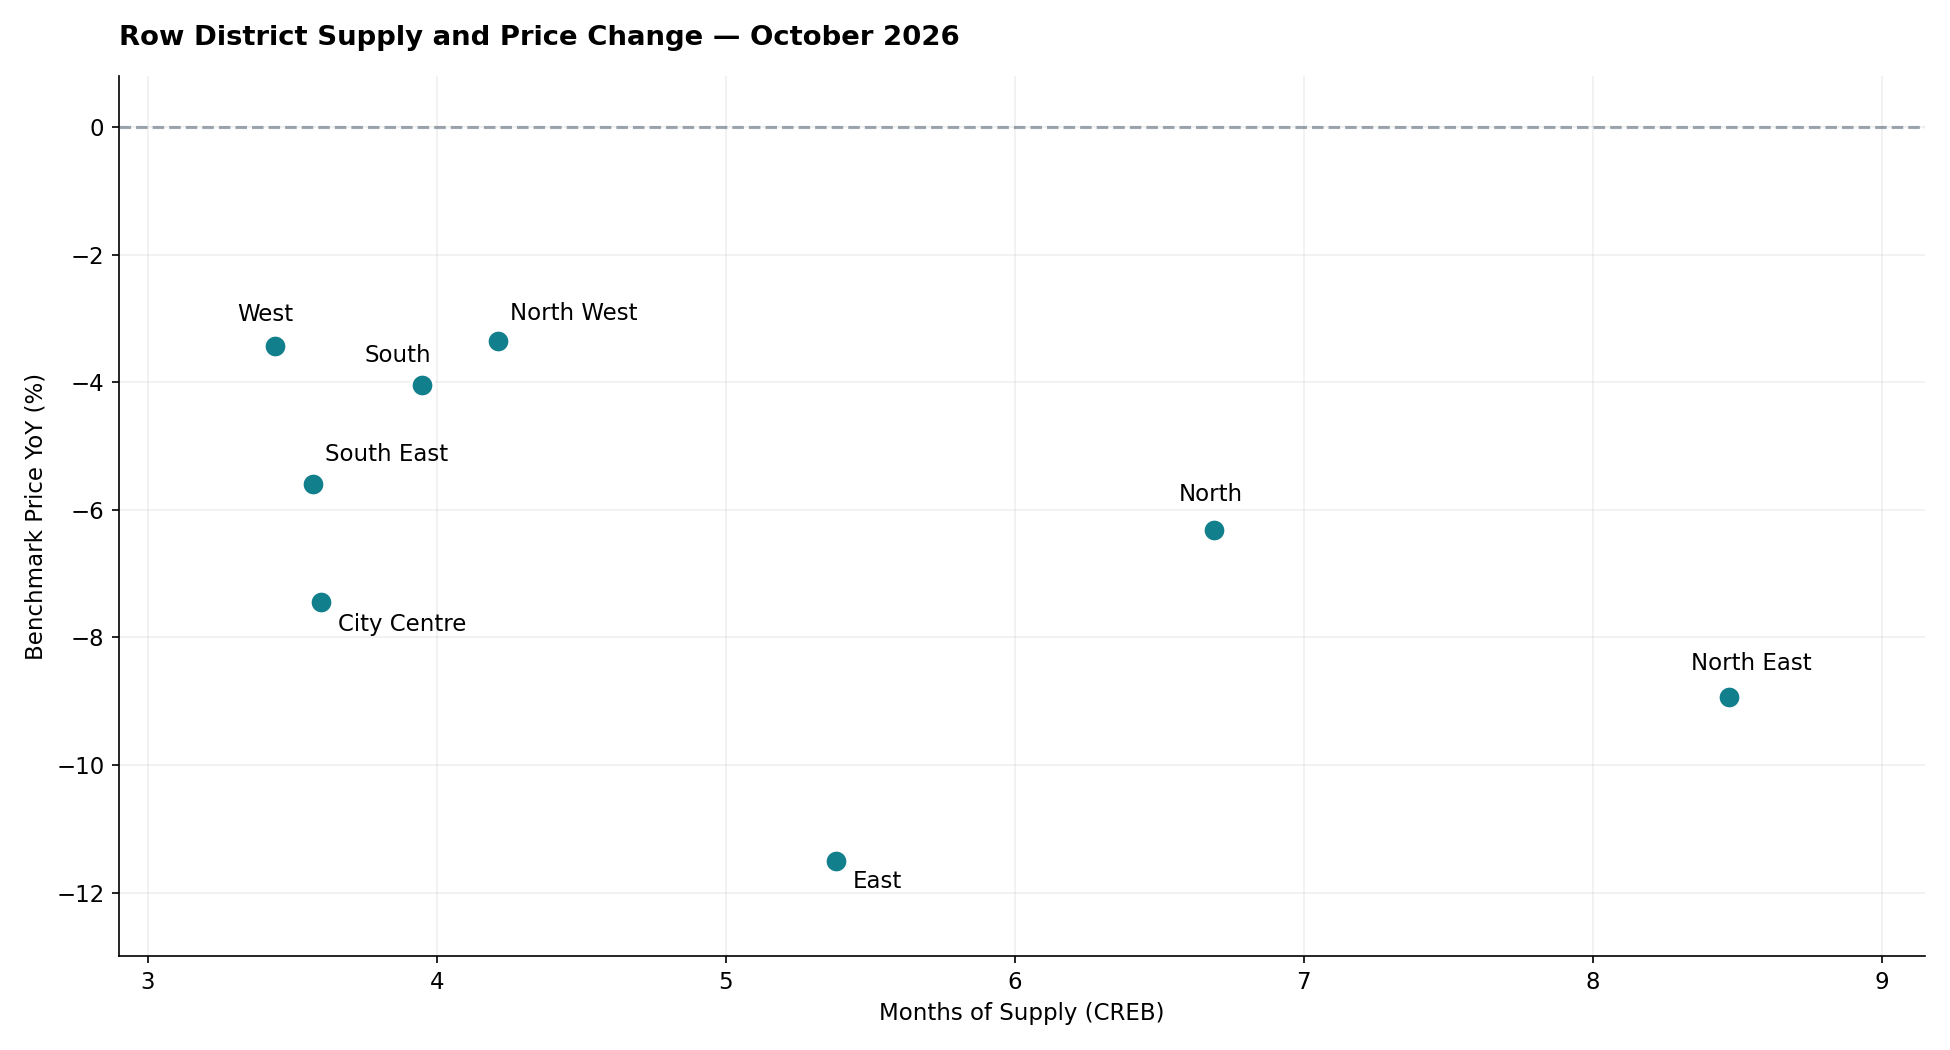
Row market conditions also differed materially across Calgary's eight districts. In October, the North East recorded 8.47 months of supply and the North 6.69, the two highest district figures. The East followed at 5.38, while the North West stood at 4.21. Those observations point to notably more listings relative to monthly sales in the northern and eastern districts than in several other parts of the city.
At the other end, West had 3.44 months of supply, South East 3.57 and City Centre 3.60. South was close to those districts at 3.95. The gaps are substantial enough that buyers comparing homes across district boundaries would encounter materially different counts of available competing properties relative to recent sales. These figures are descriptive district measures, not separate district market classifications.
All eight districts recorded year-over-year benchmark-price declines, but the magnitudes varied. East fell 11.51%, North East 8.93% and City Centre 7.45%. North West and West had comparatively smaller declines of 3.35% and 3.44%. Benchmark price levels also differed significantly, from $253,700 in East to $554,300 in City Centre, reflecting distinct district market compositions. The scatter chart places each district's months of supply alongside its annual price change without asserting that one measure caused the other.
CREB's published district totals differ from its city-wide Row totals by one sale and one inventory listing. The report preserves each official figure in its assigned geographic scope.
| District | Sales | Inventory | Months of Supply | Benchmark Price | Benchmark Price YoY |
|---|---|---|---|---|---|
| City Centre | 43 | 155 | 3.60 | $554,300 | -7.45% |
| North East | 17 | 144 | 8.47 | $328,400 | -8.93% |
| North | 26 | 174 | 6.69 | $373,400 | -6.32% |
| North West | 28 | 118 | 4.21 | $418,500 | -3.35% |
| West | 32 | 110 | 3.44 | $434,500 | -3.44% |
| South | 44 | 174 | 3.95 | $367,400 | -4.05% |
| South East | 42 | 150 | 3.57 | $412,900 | -5.60% |
| East | 8 | 43 | 5.38 | $253,700 | -11.51% |
What Is Driving the Row Market
The main internal mechanism is the relationship between sales and the pool of available homes. City-wide Row sales were below their year-earlier level and lower than the spring peak, while October inventory was slightly higher than in October 2025. The resulting rise in months of supply indicates that the existing stock was being absorbed more slowly relative to the current monthly sales pace. This explains the city's Buyer's Market classification under the fixed framework without introducing outside causes.
Price-range evidence adds a second layer. Sub-$400,000 sales increased modestly, but several middle and upper ranges experienced sizeable declines. New listings in some of those weaker ranges also fell year over year, showing that reduced listing inflow did not necessarily translate into stronger transactions. Meanwhile, the supplied active-only counts demonstrate that substantial choice remained concentrated in familiar middle-price bands. New listing flow, completed transactions and current advertised availability describe different stages of the market; none should be treated as interchangeable.
District differences reinforce the same point. A city-wide average combines places with relatively low and very high months of supply, and annual benchmark-price declines vary considerably across districts. The higher supply readings in the North East and North contrast with tighter relative supply in West and South East. These differences mean there is no single competitive condition that can accurately describe every row home in Calgary.
Taken together, the evidence supports a market with uneven demand across prices and locations, not a uniform loss of activity. It also explains why the city-wide benchmark and months of supply are useful starting points but insufficient substitutes for current comparable sales and competing listings.
What This Means for Buyers and Sellers
For buyers, the October Row figures suggest more opportunity to compare alternatives than the headline sales count alone reveals. Inventory remained above its year-earlier level while sales weakened, and the city's months of supply crossed the fixed threshold used for the Buyer's Market designation. That combination can make property-specific comparisons more useful: similar asking prices may represent different value when recent sale evidence, condition and the number of competing homes differ. It does not mean every property will attract weak interest or that a particular discount is warranted.
The district data makes location particularly important. An available row home in North East, where months of supply was relatively high, enters a different district-level supply picture from a property in West or South East. District figures are broad measures; they do not replace a community-level review of nearby alternatives. Likewise, lower-price segments saw comparatively resilient completed sales even as transactions weakened in several higher bands. Buyers should not infer that the city-wide decline describes each price range equally.
For sellers, a single city-wide benchmark-price movement is too broad to establish an individual home's competitive position. The amount and quality of directly competing active inventory, together with recent sold comparables, provide the more relevant frame for an asking price and marketing expectations. The relatively large active-only counts in the $300,000 to $499,999 bands suggest considerable choice within the supplied listing snapshot, but individual homes may differ in layout, ownership structure, condition and location.
Sales comparisons also require attention to the underlying sample. The gain in sales at $800,000 and above was based on only six transactions, so its percentage increase is not a stable guide to pricing decisions. The most useful reading is therefore conditional and evidence-based: current Row buyers and sellers should evaluate the applicable price band and district before drawing conclusions from the overall city-wide status. The reported measures describe market conditions, not guaranteed outcomes for an individual transaction.
What to Watch Next
The first relationship to monitor is Row sales relative to inventory. A sustained improvement in sales alongside declining inventory would reduce months of supply and indicate stronger absorption. If sales remain subdued while inventory stays elevated, buyers would continue to see a relatively broad field of competing homes.
Second, watch the sales distribution by price range. Further weakening from $400,000 through $799,999 would confirm that October's softer transaction activity extended beyond a single month. A recovery there, particularly alongside changes in new listings, would indicate that the current divergence is narrowing.
Third, monitor how the district supply gaps change. Convergence between the higher-supply North East and North and the lower-supply West or South East would suggest a more uniform market. Widening gaps would reinforce the need for localized comparisons. Annual benchmark-price changes should be reviewed alongside, not assumed to follow automatically from, those supply readings. None of these indicators alone constitutes a forecast.
Explore the Market in More Detail
Sources and Methodology
Official CREB® City of Calgary Monthly Statistics for October 2026 supplies the headline Row indicators, the 13-month activity series, official price-range sales and district comparisons.
Additional counts of new and Active Row listings by price range come from the supplied Pillar 9™ MLS® System records. New Listings use the listing-contract date and original list price; Active Listings use Active status and current asking price. These are different populations from official CREB Inventory. The listing dataset is treated as a supplied analytical snapshot rather than independently certified as a complete upstream export.
Month-over-month and year-over-year comparisons should be interpreted alongside the applicable price band and location. Market Status is assigned from the official city-wide Row months of supply; no market-status classification is assigned to individual price ranges or districts.