
If you looked at Calgary's July 2026 real estate numbers, you could reasonably come away with two very different conclusions about home prices.
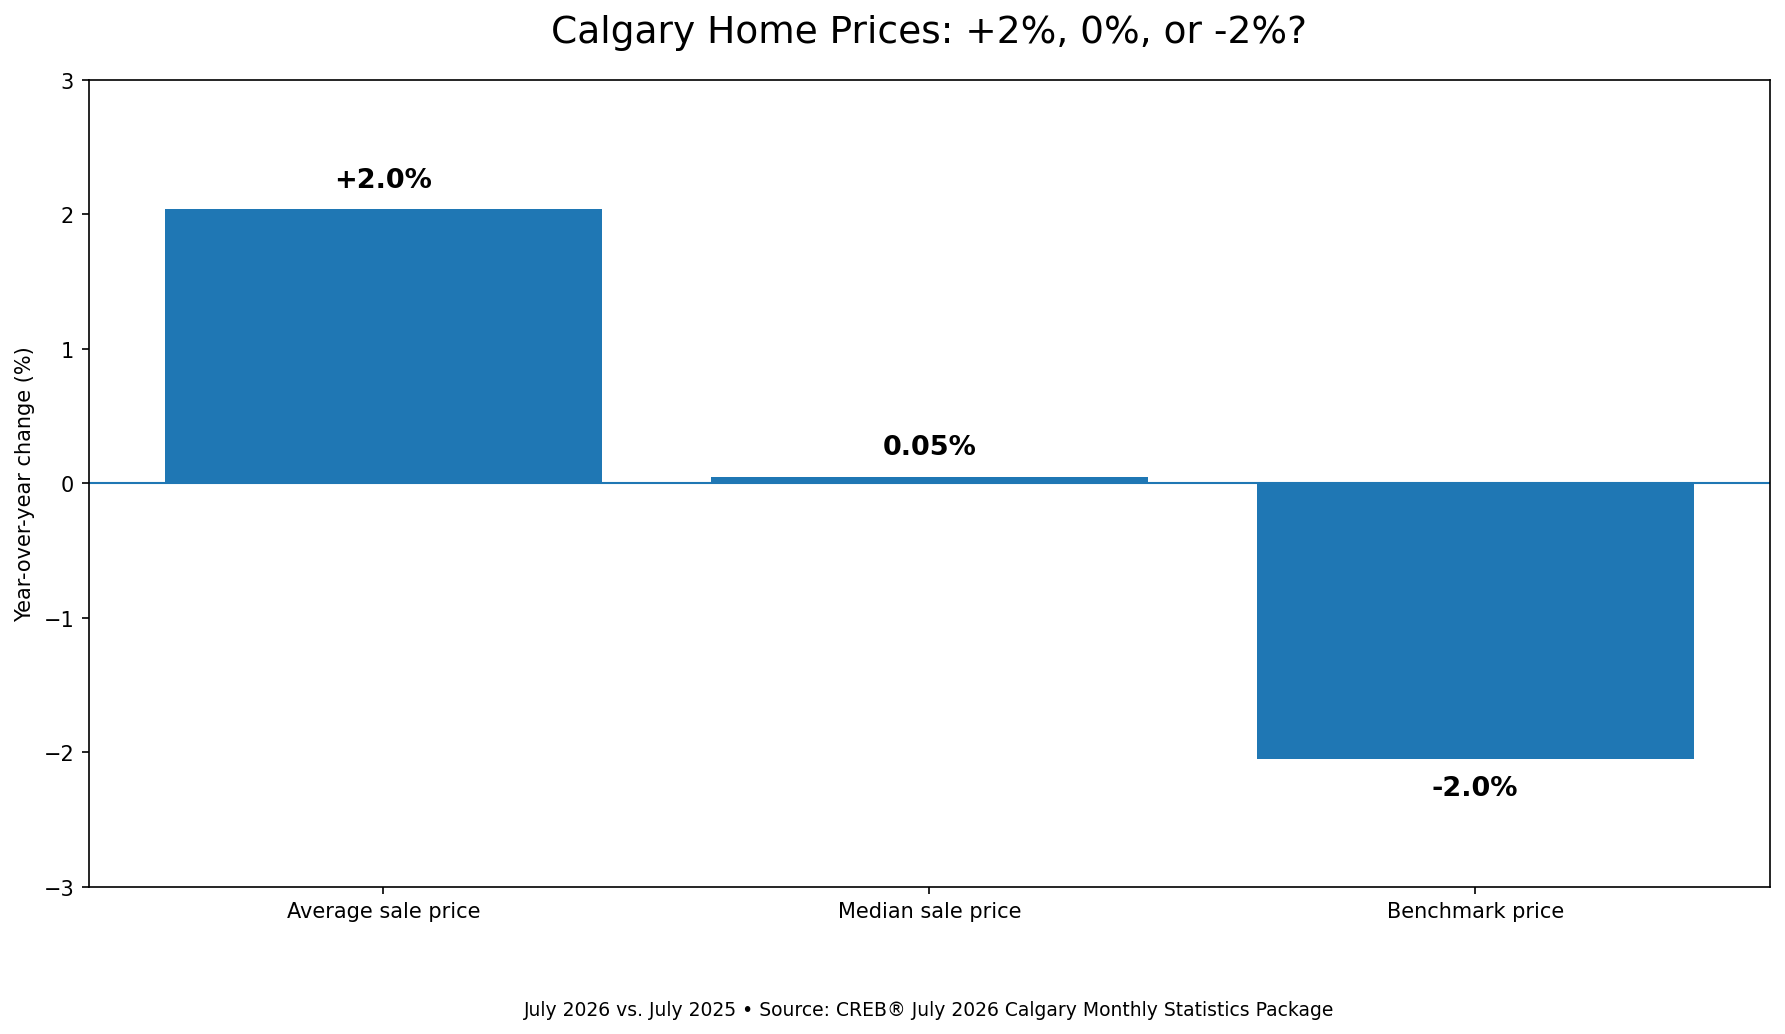
The average residential sale price was $629,855, up 2.0% from July 2025.
At the same time, Calgary's residential benchmark price was $569,200, down 2.1% year over year.
Both numbers are correct.
There was even a third result in between them: the median price was $570,050, virtually unchanged from a year earlier.
So how can Calgary home prices be up 2%, down 2% and essentially unchanged at the same time?
The answer is that these measures are telling us different things about the market.
Average Price Benchmark Price Median Price Why It Matters So, Up or Down?
The average sale price is straightforward: higher-priced sales pull the average upward, while lower-priced sales pull it downward.
That means the average can change even when the underlying value of comparable homes has not changed by the same amount.
July provides a particularly good example.
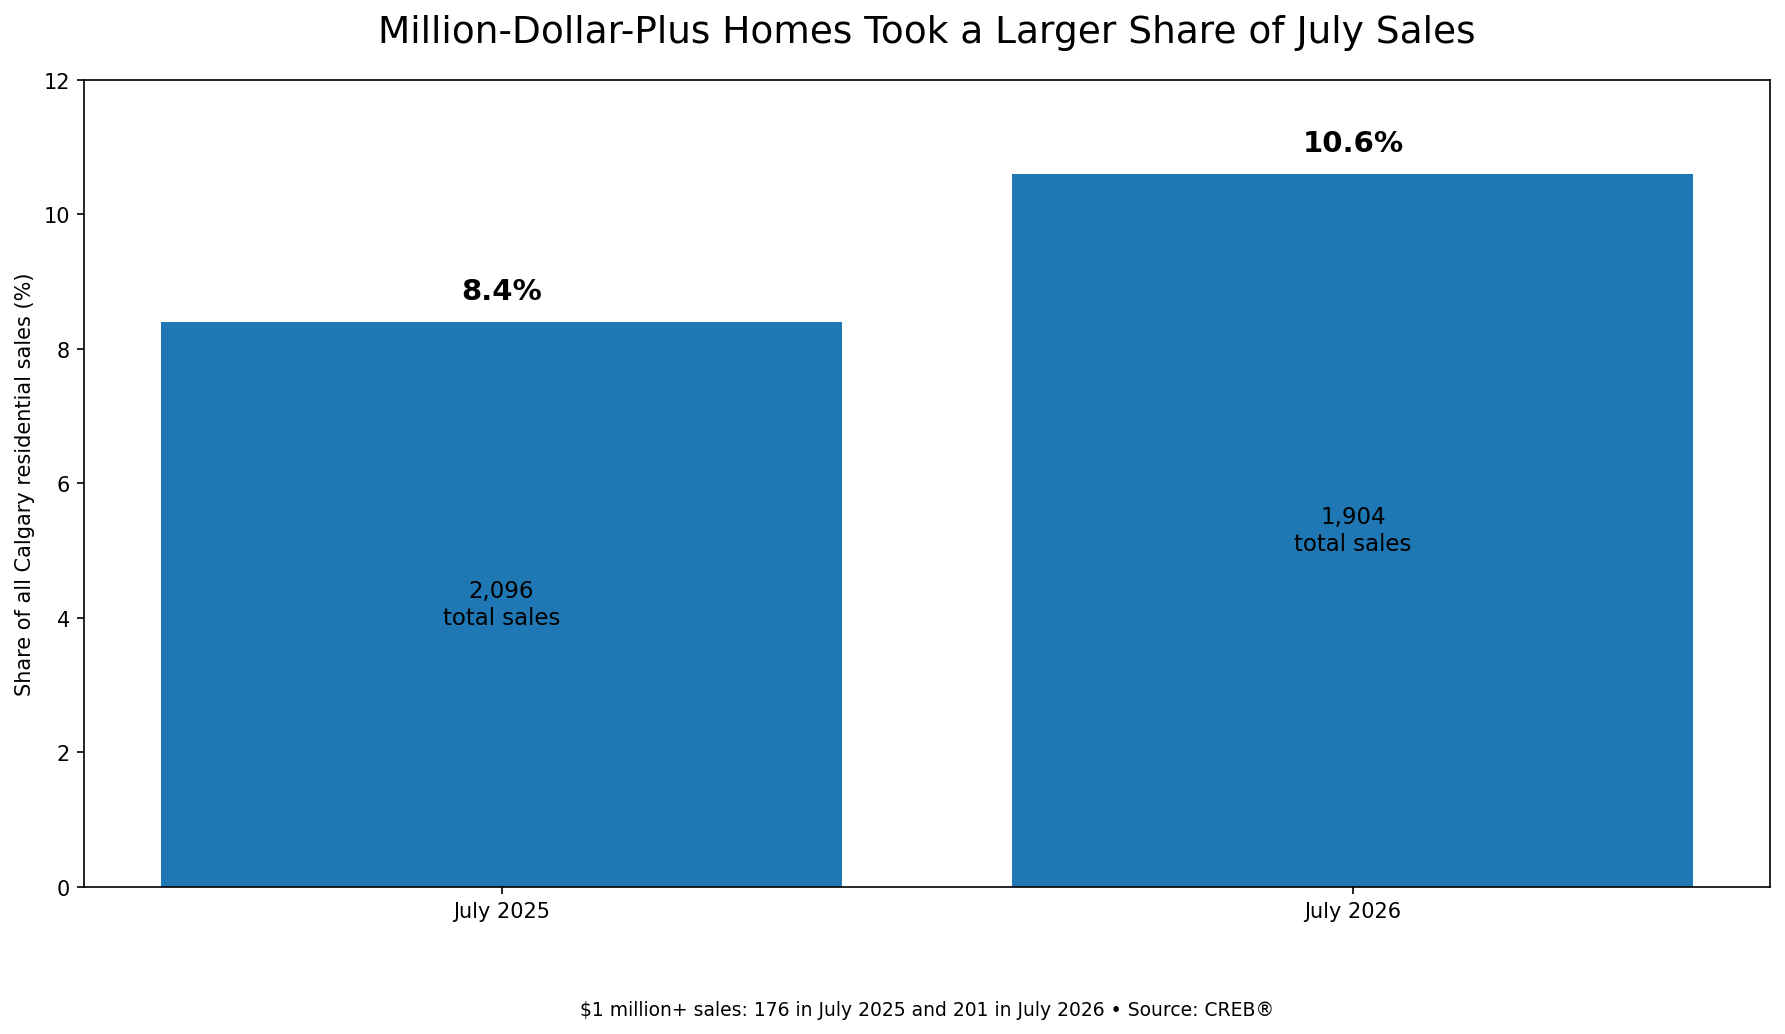
Calgary recorded 1,904 residential sales in July 2026, down 9.2% from 2,096 sales a year earlier. The total dollar value of those sales fell by a smaller 7.3%, reflecting the higher average price of the homes that sold.
The price-range data helps explain why. Calgary sold fewer homes overall, but the mix of those sales shifted somewhat toward more expensive properties.
Sales between $1 million and $1.299 million increased from 86 in July 2025 to 110 this July, while sales above $2 million increased from 16 to 22.
Combined, there were 201 sales of $1 million or more in July 2026, compared with 176 a year earlier.
That happened even though total sales across the city declined.
As a result, homes selling for $1 million or more represented about 10.6% of July sales, compared with approximately 8.4% one year earlier.
Meanwhile, activity declined considerably in several price ranges below $750,000. For example, sales between $300,000 and $349,999 fell from 173 to 115, while sales between $650,000 and $699,999 declined from 157 to 123.
This doesn't prove that the shift toward higher-priced sales explains the entire increase in Calgary's average price. But it demonstrates why an average sale price can rise even while another measure of home values is falling.
CREB's benchmark price estimates the price of a typical home using attributes like living area, lot size and bedrooms, rather than a simple sales average. Statistical models apply these attributes to a “benchmark home”—a representative mix of features, not an actual property. This method reduces the effect of monthly changes in the mix of homes sold, offering a more consistent view of price trends over time.
And in July, the benchmark numbers were telling a noticeably softer story.
Calgary's total residential benchmark price declined 2.1% year over year to $569,200.
The decline was far from uniform across property types.
Detached homes had a benchmark price of $743,900, down 1.9% year over year, while semi-detached homes were almost unchanged at $691,000, down just 0.3%.
The larger declines occurred in the higher-density segments. Row homes fell 6.1% to $418,500, while apartments dropped 8.4% to $297,600. CREB characterized July's overall price decline as being driven mostly by apartment condominiums.
That distinction is important because Calgary does not have one uniform housing market. Changes in supply, demand and prices can look very different depending on whether we are talking about a detached house, semi-detached property, row home or apartment.
The median residential sale price provides another useful piece of the puzzle.
At $570,050, Calgary's July median was just 0.05% higher than the $569,750 recorded in July 2025.
In other words:
Seeing those three measures together should make us cautious about using any single headline number to describe what has happened to "Calgary home prices."
The average tells us something important about the dollar value and composition of the homes being purchased.
The median tells us where the middle transaction occurred.
The benchmark provides another perspective on how residential values are changing while reducing some of the influence created by changes in the mix of properties being sold.
They are related measures, but they are not interchangeable.
Suppose you own a typical Calgary home and hear that the city's average sale price increased 2% over the past year.
It would be tempting to conclude that your property probably increased in value by roughly the same amount.
July's numbers show why that can be misleading.
An increase in the average price can result partly from which homes are selling, not simply from individual properties becoming more valuable.
The opposite can happen as well. If an unusually large number of lower-priced properties sell during a particular month, the average price can fall even without a comparable decline in the value of individual homes.
For a homeowner trying to understand what their property might be worth today, the more relevant questions are much more specific:
What type of property is it?
Where in Calgary is it located?
What price range does it compete in?
And what is happening to supply and demand within that particular segment of the market?
July's district numbers reinforce that point. Even within the detached market, benchmark price changes ranged from a 2.3% year-over-year increase in the West District to a 6.0% decline in the North East.
A city-wide average simply cannot capture differences of that magnitude.
See what is happening in your part of Calgary. Explore Calgary market reports by property type and community to see how sales, inventory and prices are changing in the market most relevant to your home.
If someone says Calgary's average home price increased 2% in July, they are correct.
If someone says Calgary's benchmark home price declined 2%, they are also correct.
The mistake would be assuming those statements mean the same thing.
July 2026 is a particularly clear example of why real estate statistics need context. Calgary had fewer sales, a somewhat greater share of transactions at the upper end of the market, an almost unchanged median price and declining benchmark prices—particularly in row and apartment properties.
So the most useful conclusion isn't that Calgary home prices were simply "up" or "down."
It's that the answer depends on what you're measuring—and, for an individual homeowner or buyer, which part of the Calgary market you're actually in.
For a broader look at sales, inventory, months of supply and price trends, see the Calgary July 2026 Market Report.